High Island High School
Rating
Not Available
Not Available

No Reviews Yet
Find Old Friends From High Island High School
Use the form below to search for alumni from High Island High School.
School Description
School Summary and Highlights
- Enrolls 82 high school students from grades 9-12
- Ranks 583rd out of 1,325 high schools in TX.
- 2010 Overall School AYP Met Status: Yes
Additional Contact Information
- Mailing Address: P O Box 246, High Island, TX 77623
- Principal or Admin: Mr Mike Sims
- Fax: (409) 286-2120
- Website: www.esc05.k12.tx.us
School Operational Details
- Title I EligibleAll students of this school are eligible for participation in authorized programs.
School District Details
- High Island Independent School District (ISD)
- Per-Pupil Spending: $13,507
- Graduation Rate: 73.1%
- Dropout Rate: 3.4%
- Students Per Teacher: 10.8
- Enrolled Students: 186
Faculty Details and Student Enrollment
Students and Faculty
- Total Students Enrolled: 82
- Total Full Time "Equivalent" Teachers: 7.9
- Average Student-To-Teacher Ratio: 10.5
Students Gender Breakdown
- Males: 48 (58.5%)
- Females: 34 (41.5%)
Free Lunch Student Eligibility Breakdown
- Eligible for Reduced Lunch: 8 (9.8%)
- Eligible for Free Lunch: 41 (50.0%)
- Eligible for Either Reduced or Free Lunch: 49 (59.8%)
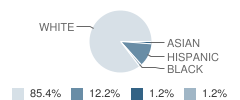
Student Enrollment Distribution by Race / Ethnicity
| Number | Percent | |
|---|---|---|
| American Indian | - | - |
| Black | 1 | 1.2% |
| Asian | 1 | 1.2% |
| Hispanic | 10 | 12.2% |
| White | 70 | 85.4% |
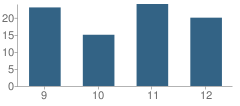
Number of Students Per Grade
| Number | Percent | |
|---|---|---|
| 9th Grade | 23 | 28.0% |
| 10th Grade | 15 | 18.3% |
| 11th Grade | 24 | 29.3% |
| 12th Grade | 20 | 24.4% |
Breakdown of College Ready Graduates (2009)
Percent Ready For College in Reading
School:
41.0%
District:
41.0%
State:
62.0%
Percent Ready For College in Math
School:
35.0%
District:
30.0%
State:
60.0%
Graduation & Dropout Rates (2009)
Graduation Rate
School:
73.9%
District:
73.9%
State:
80.6%
Dropout Rate
School:
17.4%
District:
17.4%
State:
9.4%
Faculty Salary (2010)
School Administration Average Base Salary
School:
$81,660
District:
$81,660
State:
$70,209
Teacher Average Base Salary
School:
$40,325
District:
$38,778
State:
$48,263
Teacher With 1-5 Years Experience Average Base Salary
School:
$30,014
State:
$43,527
Teacher With 6-10 Years Experience Average Base Salary
School:
$37,586
State:
$46,149
Teacher With 11-20 Years Experience Average Base Salary
School:
$45,420
State:
$50,153
Teacher With Greater Than 20 Years Experience Average Base Salary
School:
$46,959
State:
$58,427
Faculty Breakdown (2010)
Average Teacher Experience
School:
13.2
District:
12.6
State:
11.3
Percent of Teachers With 1-5 Years Experience
School:
31.7%
District:
23.3%
State:
31.0%
Percent of Teachers With 6-10 Years Experience
School:
6.9%
District:
11.6%
State:
20.3%
Percent of Teachers With 11-20 Years Experience
School:
39.5%
District:
34.9%
State:
24.4%
Percent of Teachers With Greater Than 20 Years Experience
School:
21.8%
District:
20.0%
State:
18.3%
Source: TX Department of Education, Source: NCES 2009-2010
School Ratings and Reviews
Be The First To Review High Island High School!
School Map and Similar Schools Nearby
Click to Activate Map of Nearby School Campuses
Private
Public
This School
Similar Schools Nearby
| East Chambers Junior High School 7-8 | 190 Students | 15.4 miles away | Not Yet Rated | |
| East Chambers High School 9-12 | 357 Students | 16.8 miles away |  2.5 out of 5 | |
| Hamshire-Fannett High School 9-12 | 544 Students | 21.2 miles away | Not Yet Rated | |
| Anahuac High School 9-12 | 409 Students | 22.4 miles away |  5 out of 5 | |
Compare This School To Nearby Schools ->
Navigation
Can't Find What You Are Looking For?
Nearby Cities
Sponsored Links
K-12 Articles

Homework Helps
School has started throughout the country and is well into the first month-some schools are...
School has started throughout the country and is well into the first month-some schools are...

Everyone Loves Going to the Doctor and Dentist
Going to the doctor or dentist can be traumatic for children of all ages. Many adults do not...
Going to the doctor or dentist can be traumatic for children of all ages. Many adults do not...

Homework Tips: Taking the Work out of Homework
Kids hate homework. It seems that almost every night of the week they are overloaded with...
Kids hate homework. It seems that almost every night of the week they are overloaded with...