King City High School

No Reviews Yet
Find Old Friends From King City High School
Use the form below to search for alumni from King City High School.
School Description
School Summary and Highlights
- Enrolls 996 high school students from grades 9-12
- Ranks 671st out of 1,197 high schools in CA.
- 2010 Overall School AYP Met Status: No
School Operational Details
- Title I EligibleAll students of this school are eligible for participation in authorized programs.
School District Details
- King City Joint Union High School District
- Per-Pupil Spending: $8,891
- Graduation Rate: 92.6%
- Dropout Rate: 3.0%
- Students Per Teacher: 27.0
- Enrolled Students: 2,075
Faculty Details and Student Enrollment
Students and Faculty
- Total Students Enrolled: 996
- Total Full Time "Equivalent" Teachers: 35.7
- Average Student-To-Teacher Ratio: 27.9
Students Gender Breakdown
- Males: 511 (51.3%)
- Females: 485 (48.7%)
Free Lunch Student Eligibility Breakdown
- Eligible for Reduced Lunch: 111 (11.1%)
- Eligible for Free Lunch: 330 (33.1%)
- Eligible for Either Reduced or Free Lunch: 441 (44.3%)
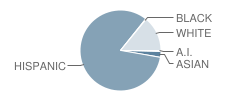
Student Enrollment Distribution by Race / Ethnicity

| Number | Percent | |
|---|---|---|
| American Indian | 4 | 0.4% |
| Black | 2 | 0.2% |
| Asian | 23 | 2.3% |
| Hispanic | 826 | 82.9% |
| White | 140 | 14.1% |
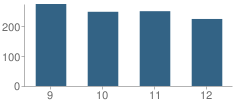
Number of Students Per Grade

| Number | Percent | |
|---|---|---|
| 9th Grade | 274 | 27.5% |
| 10th Grade | 248 | 24.9% |
| 11th Grade | 250 | 25.1% |
| 12th Grade | 224 | 22.5% |
Graduates Information (2010)
Graduation Rate
School:
81.7%
District:
78.7%
State:
78.6%
Teacher Education Background (2009)
Percent With Master's Degree
School:
15.2%
District:
33.3%
Percent With Bachelor's Degree: 4.3%
Teacher Credentials & Experience (2009)
Percent of Teachers With Emergency Credentials: 4.8%
Percent of Teachers With Credentials: 90.5%
Number of Certificated Staff: 46.0
Average Number of Years of Teacher Experience: 16.3
Average Age
School:
42.4
District:
57.3
Source: CA Department of Education, Source: NCES 2009-2010
School Ratings and Reviews
Be The First To Review King City High School!
Sponsored Links
Test Scores and Performance Information
Overall School Rating
How is this determined?
The overall school rating shows that King City High School performed on average about the same as other schools across the state on CST state exams in the following subjects:
- CST Algebra I
- CST Algebra II
- CST Biology
- CST Chemistry
- CST Earth Science
- CST English-Language Arts
- CST General Mathematics
- CST Geometry
- CST Physics
- CST Science
- CST Summative High School Math
- CST U.S. History
- CST World History
AYP Results (2010)
Overall AYP Met: No
ELA AYP Met: No
Math AYP Met: No
Program Improvement (PI) Requirement Under NCLB (2010)
First Year PI Requirement was Implemented: 2009-2010
School's Placement Under NCLB: Year 2
ACT Exam Results (2009)
Percent of Students Taking ACT Exam: 5.7%
Average Combined Score: 22.1
Percent Scoring At or Above 21: 57.1%
SAT Exam Results (2009)
Percent of Students Taking SAT Exam: 18.4%
Average Combined Score: 1,405.6
Critical Reading Average: 470.4
Math Average: 464.7
Writing Average: 470.4
Percent Scoring At or Above 1500: 28.9%
CST - Test Proficiency by Grade and Subject
Grade 9 - % of students at or above proficiency
| School | District | State | |
|---|---|---|---|
| CST Algebra I Test | |||
| 2010 | 33.0% | 22.0% | 22.0% |
| 2009 | 24.0% | 15.0% | 21.0% |
| 2008 | 16.0% | 11.0% | 18.0% |
| CST Biology Test | |||
| 2010 | 60.0% | 59.0% | 55.0% |
| 2009 | 31.0% | 40.0% | 51.0% |
| 2008 | 22.0% | 27.0% | 52.0% |
| CST Earth Science Test | |||
| 2010 | 21.0% | 22.0% | 35.0% |
| 2009 | 10.0% | 8.0% | 29.0% |
| 2008 | 10.0% | 7.0% | 31.0% |
| CST English-Language Arts Test | |||
| 2010 | 44.0% | 43.0% | 54.0% |
| 2009 | 39.0% | 33.0% | 50.0% |
| 2008 | 32.0% | 28.0% | 49.0% |
| CST Geometry Test | |||
| 2010 | 42.0% | 19.0% | 46.0% |
| 2009 | 36.0% | 31.0% | 47.0% |
| 2008 | 16.0% | 18.0% | 43.0% |
| CST General Mathematics Test | |||
| 2008 | 16.0% | 11.0% | 18.0% |
| CST World History Test | |||
| 2008 | 6.0% | 5.0% | 36.0% |
Grade 10 - % of students at or above proficiency
| School | District | State | |
|---|---|---|---|
| CST Algebra I Test | |||
| 2010 | 13.0% | 9.0% | 12.0% |
| 2009 | 22.0% | 13.0% | 11.0% |
| 2008 | 10.0% | 6.0% | 9.0% |
| CST Algebra II Test | |||
| 2010 | 38.0% | 34.0% | 40.0% |
| 2009 | 15.0% | 19.0% | 37.0% |
| 2008 | 18.0% | 12.0% | 36.0% |
| CST Biology Test | |||
| 2010 | 28.0% | 35.0% | 38.0% |
| 2009 | 14.0% | 14.0% | 34.0% |
| 2008 | 19.0% | 11.0% | 35.0% |
| CST Chemistry Test | |||
| 2010 | 31.0% | 31.0% | 47.0% |
| 2009 | 12.0% | 16.0% | 44.0% |
| 2008 | 22.0% | 20.0% | 41.0% |
| CST Earth Science Test | |||
| 2010 | 24.0% | 23.0% | 29.0% |
| 2009 | 22.0% | 19.0% | 23.0% |
| 2008 | 18.0% | 12.0% | 23.0% |
| CST English-Language Arts Test | |||
| 2010 | 37.0% | 34.0% | 45.0% |
| 2009 | 31.0% | 25.0% | 44.0% |
| 2008 | 33.0% | 25.0% | 41.0% |
| CST Geometry Test | |||
| 2010 | 13.0% | 7.0% | 14.0% |
| 2009 | 15.0% | 7.0% | 14.0% |
| 2008 | 9.0% | 3.0% | 12.0% |
| CST Science Test | |||
| 2010 | 33.0% | 30.0% | 46.0% |
| 2009 | 25.0% | 20.0% | 44.0% |
| 2008 | 26.0% | 19.0% | 40.0% |
| CST World History Test | |||
| 2010 | 41.0% | 32.0% | 42.0% |
| 2009 | 34.0% | 22.0% | 38.0% |
| 2008 | 21.0% | 16.0% | 33.0% |
Grade 11 - % of students at or above proficiency
| School | District | State | |
|---|---|---|---|
| CST Algebra I Test | |||
| 2010 | 17.0% | 10.0% | 8.0% |
| 2009 | 15.0% | 9.0% | 8.0% |
| 2008 | 9.0% | 6.0% | 5.0% |
| CST Algebra II Test | |||
| 2010 | 30.0% | 13.0% | 14.0% |
| 2009 | 6.0% | 2.0% | 12.0% |
| 2008 | 19.0% | 8.0% | 11.0% |
| CST Biology Test | |||
| 2010 | 16.0% | 21.0% | 46.0% |
| 2009 | 30.0% | 23.0% | 41.0% |
| 2008 | 26.0% | 23.0% | 39.0% |
| CST Chemistry Test | |||
| 2010 | 12.0% | 22.0% | 30.0% |
| 2009 | 6.0% | 6.0% | 27.0% |
| 2008 | 6.0% | 13.0% | 25.0% |
| CST Earth Science Test | |||
| 2010 | 38.0% | 23.0% | 32.0% |
| 2009 | 12.0% | 10.0% | 26.0% |
| 2008 | 15.0% | 9.0% | 28.0% |
| CST English-Language Arts Test | |||
| 2010 | 37.0% | 31.0% | 42.0% |
| 2009 | 31.0% | 22.0% | 40.0% |
| 2008 | 27.0% | 22.0% | 37.0% |
| CST Geometry Test | |||
| 2010 | 6.0% | 4.0% | 6.0% |
| 2009 | 2.0% | 1.0% | 7.0% |
| 2008 | 3.0% | 2.0% | 6.0% |
| CST Physics Test | |||
| 2010 | 44.0% | 16.0% | 53.0% |
| 2009 | 28.0% | 15.0% | 50.0% |
| 2008 | 61.0% | 25.0% | 47.0% |
| CST Summative High School Math Test | |||
| 2010 | 25.0% | 35.0% | 50.0% |
| 2009 | 30.0% | 21.0% | 47.0% |
| 2008 | 50.0% | 27.0% | 43.0% |
| CST U.S. History Test | |||
| 2010 | 46.0% | 36.0% | 45.0% |
| 2009 | 37.0% | 28.0% | 44.0% |
| 2008 | 35.0% | 27.0% | 38.0% |
| CST World History Test | |||
| 2009 | 11.0% | 18.0% | 11.0% |
End of Course - % of students at or above proficiency
| School | District | State | |
|---|---|---|---|
| CST Algebra I Test | |||
| 2010 | 25.0% | 17.0% | 31.0% |
| 2009 | 22.0% | 14.0% | 28.0% |
| 2008 | 13.0% | 8.0% | 25.0% |
| CST Algebra II Test | |||
| 2010 | 37.0% | 23.0% | 31.0% |
| 2009 | 10.0% | 7.0% | 28.0% |
| 2008 | 19.0% | 9.0% | 27.0% |
| CST Biology Test | |||
| 2010 | 40.0% | 39.0% | 46.0% |
| 2009 | 25.0% | 27.0% | 42.0% |
| 2008 | 23.0% | 23.0% | 42.0% |
| CST Chemistry Test | |||
| 2010 | 23.0% | 27.0% | 38.0% |
| 2009 | 9.0% | 10.0% | 36.0% |
| 2008 | 15.0% | 16.0% | 32.0% |
| CST Earth Science Test | |||
| 2010 | 24.0% | 22.0% | 33.0% |
| 2009 | 14.0% | 11.0% | 28.0% |
| 2008 | 13.0% | 9.0% | 28.0% |
| CST Geometry Test | |||
| 2010 | 16.0% | 9.0% | 27.0% |
| 2009 | 17.0% | 10.0% | 26.0% |
| 2008 | 8.0% | 6.0% | 24.0% |
| CST Physics Test | |||
| 2010 | 44.0% | 15.0% | 49.0% |
| 2009 | 31.0% | 13.0% | 46.0% |
| 2008 | 60.0% | 15.0% | 43.0% |
| CST Summative High School Math Test | |||
| 2010 | 29.0% | 36.0% | 54.0% |
| 2009 | 30.0% | 21.0% | 50.0% |
| 2008 | 54.0% | 30.0% | 47.0% |
| CST World History Test | |||
| 2010 | 41.0% | 32.0% | 41.0% |
| 2009 | 33.0% | 21.0% | 38.0% |
| 2008 | 20.0% | 15.0% | 33.0% |
| CST General Mathematics Test | |||
| 2008 | 16.0% | 11.0% | 27.0% |
Source: CA Department of Education 2009-2010
School Map and Similar Schools Nearby
Click to Activate Map of Nearby School Campuses
Private
Public
This School
Similar Schools Nearby
| Greenfield High School 9-12 | 964 Students | 9.4 miles away | ![]() 3.5 out of 5 | |
| Soledad High School 9-12 | 1,127 Students | 19.1 miles away | Not Yet Rated | |
| Gonzales High School 9-12 | 700 Students | 27.0 miles away | ![]() 3.5 out of 5 | |
| Pacific Valley (K-12) School KG-12 | 12 Students | 27.5 miles away | ![]() 5 out of 5 | - |
Compare This School To Nearby Schools ->
School Community Forum

Join a discussion about King City High School and talk to others in the community including students, parents, teachers, and administrators.
Popular Discussion Topics
- Admissions and Registration Questions (e.g. Dress Code and Discipline Policy)
- School Calendar and Upcoming Events (e.g. Graduation)
- After School Programs, Extracurricular Activities, and Athletics (e.g. Football)
- News and Announcements (e.g. Yearbook and Class Supply List Details)
- Graduate and Alumni Events (e.g. Organizing Class Reunions)
Navigation
Can't Find What You Are Looking For?
Rankings
Nearby Cities
Sponsored Links
K-12 Articles
Tips for Purchasing Back to School Supplies
In just a few days, kids from all over the US will be going back to school. Now is the time to take...
Bullies... What Are They Good For?
Bullies have been around since the beginning of time. We had to deal with bullies, and our parents...
The Cervical Cancer Vaccine
All across North America girls between the ages of 11 and 12 have the opportunity to be vaccinated...


