Rochelle School
Rating
Not Available
Not Available

No Reviews Yet
Find Old Friends From Rochelle School
Use the form below to search for alumni from Rochelle School.
School Description
School Summary and Highlights
- Enrolls 213 school students from grades PK-12
- Ranks 635th out of 1,325 high schools in TX.
- 2010 Overall School AYP Met Status: Yes
Additional Contact Information
- Mailing Address: P O Box 167, Rochelle, TX 76872
- Principal or Admin: Mr Joe Skalak
- Fax: (915) 243-5216
- Website: centex-edu.net
School Operational Details
- Title I EligibleAll students of this school are eligible for participation in authorized programs.
School District Details
- Rochelle Independent School District (ISD)
- Per-Pupil Spending: $12,042
- Graduation Rate: 72.2%
- Students Per Teacher: 9.9
- Enrolled Students: 213
Faculty Details and Student Enrollment
Students and Faculty
- Total Students Enrolled: 213
- Total Full Time "Equivalent" Teachers: 21.6
- Average Student-To-Teacher Ratio: 9.9
Students Gender Breakdown
- Males: 110 (51.6%)
- Females: 103 (48.4%)
Free Lunch Student Eligibility Breakdown
- Eligible for Reduced Lunch: 24 (11.3%)
- Eligible for Free Lunch: 127 (59.6%)
- Eligible for Either Reduced or Free Lunch: 151 (70.9%)
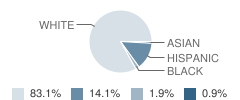
Student Enrollment Distribution by Race / Ethnicity
| Number | Percent | |
|---|---|---|
| American Indian | - | - |
| Black | 4 | 1.9% |
| Asian | 2 | 0.9% |
| Hispanic | 30 | 14.1% |
| White | 177 | 83.1% |
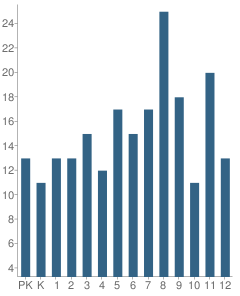
Number of Students Per Grade
| Number | Percent | |
|---|---|---|
| Pre-Kindergarten | 13 | 6.1% |
| Kindergarten | 11 | 5.2% |
| 1st Grade | 13 | 6.1% |
| 2nd Grade | 13 | 6.1% |
| 3rd Grade | 15 | 7.0% |
| 4th Grade | 12 | 5.6% |
| 5th Grade | 17 | 8.0% |
| 6th Grade | 15 | 7.0% |
| 7th Grade | 17 | 8.0% |
| 8th Grade | 25 | 11.7% |
| 9th Grade | 18 | 8.5% |
| 10th Grade | 11 | 5.2% |
| 11th Grade | 20 | 9.4% |
| 12th Grade | 13 | 6.1% |
Breakdown of College Ready Graduates (2009)
Percent Ready For College in Reading
School:
38.0%
District:
38.0%
State:
62.0%
Percent Ready For College in Math
School:
62.0%
State:
60.0%
Graduation & Dropout Rates (2009)
Graduation Rate
School:
100.0%
District:
100.0%
State:
80.6%
Faculty Breakdown (2010)
Average Teacher Experience
School:
16.8
District:
16.8
State:
11.3
Percent of Teachers With 1-5 Years Experience
School:
4.6%
District:
4.6%
State:
31.0%
Percent of Teachers With 6-10 Years Experience
School:
32.9%
District:
32.9%
State:
20.3%
Percent of Teachers With 11-20 Years Experience
School:
27.8%
District:
27.8%
State:
24.4%
Percent of Teachers With Greater Than 20 Years Experience
School:
34.7%
District:
34.7%
State:
18.3%
Faculty Salary (2010)
School Administration Average Base Salary
School:
$56,000
District:
$56,000
State:
$70,209
Teacher Average Base Salary
School:
$39,376
District:
$39,376
State:
$48,263
Teacher With 1-5 Years Experience Average Base Salary
School:
$27,910
State:
$43,527
Teacher With 6-10 Years Experience Average Base Salary
School:
$37,584
State:
$46,149
Teacher With 11-20 Years Experience Average Base Salary
School:
$40,723
State:
$50,153
Teacher With Greater Than 20 Years Experience Average Base Salary
School:
$41,523
State:
$58,427
Source: TX Department of Education, Source: NCES 2009-2010
School Ratings and Reviews
Be The First To Review Rochelle School!
School Map and Similar Schools Nearby
Click to Activate Map of Nearby School Campuses
Private
Public
This School
Similar Schools Nearby
| Brady High School 9-12 | 347 Students | 10.4 miles away | Not Yet Rated | |
| Lohn School PK-12 | 98 Students | 13.9 miles away | Not Yet Rated | |
| Richland Springs School PK-12 | 151 Students | 15.3 miles away | Not Yet Rated | |
| Brookesmith High School 9-12 | 49 Students | 22.4 miles away | Not Yet Rated | |
| San Saba High School 9-12 | 204 Students | 28.3 miles away | Not Yet Rated | |
Compare This School To Nearby Schools ->
School Community Forum

Join a discussion about Rochelle School and talk to others in the community including students, parents, teachers, and administrators.
Popular Discussion Topics
- Admissions and Registration Questions (e.g. Dress Code and Discipline Policy)
- School Calendar and Upcoming Events (e.g. Graduation)
- After School Programs, Extracurricular Activities, and Athletics (e.g. Football)
- News and Announcements (e.g. Yearbook and Class Supply List Details)
- Graduate and Alumni Events (e.g. Organizing Class Reunions)
Navigation
Can't Find What You Are Looking For?
Nearby Cities
Sponsored Links
K-12 Articles

Choosing a Summer Camp for Your Child
Are you planning to send your child to summer camp this year? If so, have you taken his needs into...
Are you planning to send your child to summer camp this year? If so, have you taken his needs into...

Adolescents, Sleep and Learning
Recently, adolescent's sleep habits have been in the news. Research has shown that adolescents need...
Recently, adolescent's sleep habits have been in the news. Research has shown that adolescents need...

Idle Hands
The worst affliction affecting our kids today is not teen pregnancy, drugs and alcohol, or...
The worst affliction affecting our kids today is not teen pregnancy, drugs and alcohol, or...