Knights Ferry Elementary School
Rating
Not Available
Not Available

No Reviews Yet
Find Old Friends From Knights Ferry Elementary School
Use the form below to search for alumni from Knights Ferry Elementary School.
School Description
School Summary and Highlights
- Enrolls 134 elementary school students from grades KG-8
- Ranks 292nd out of 2,050 middle schools in CA.
- 2010 Overall School AYP Met Status: No
Additional Contact Information
- Mailing Address: PO Box 840, Knights Ferry, CA 95361
School District Details
- Knights Ferry Elementary School District
- Per-Pupil Spending: $8,092
- Students Per Teacher: 22.3
- Enrolled Students: 134
Faculty Details and Student Enrollment
Students and Faculty
- Total Students Enrolled: 134
- Total Full Time "Equivalent" Teachers: 6.0
- Average Student-To-Teacher Ratio: 22.3
Students Gender Breakdown
- Males: 57 (42.5%)
- Females: 77 (57.5%)
Free Lunch Student Eligibility Breakdown
- Eligible for Reduced Lunch: 2 (1.5%)
- Eligible for Free Lunch: 27 (20.1%)
- Eligible for Either Reduced or Free Lunch: 29 (21.6%)
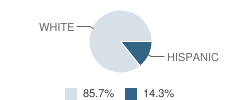
Student Enrollment Distribution by Race / Ethnicity
| Number | Percent | |
|---|---|---|
| American Indian | - | - |
| Black | - | - |
| Asian | - | - |
| Hispanic | 19 | 14.2% |
| White | 114 | 85.1% |
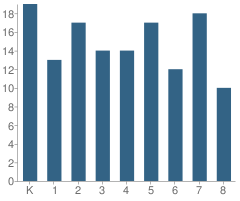
Number of Students Per Grade
| Number | Percent | |
|---|---|---|
| Kindergarten | 19 | 14.2% |
| 1st Grade | 13 | 9.7% |
| 2nd Grade | 17 | 12.7% |
| 3rd Grade | 14 | 10.4% |
| 4th Grade | 14 | 10.4% |
| 5th Grade | 17 | 12.7% |
| 6th Grade | 12 | 9.0% |
| 7th Grade | 18 | 13.4% |
| 8th Grade | 10 | 7.5% |
Teacher Credentials & Experience (2009)
Percent of Teachers With Credentials: 100.0%
Number of Certificated Staff: 8.0
Average Number of Years of Teacher Experience: 14.1
Average Age: 44.8
Source: CA Department of Education, Source: NCES 2009-2010
School Ratings and Reviews
Be The First To Review Knights Ferry Elementary School!
School Map and Similar Schools Nearby
Click to Activate Map of Nearby School Campuses
Private
Public
This School
Similar Schools Nearby
| Sierra View Elementary School KG-6 | 746 Students | 9.6 miles away |  5 out of 5 | |
| Cloverland Elementary School KG-6 | 529 Students | 9.7 miles away | Not Yet Rated | |
| Magnolia Elementary School KG-6 | 582 Students | 10.7 miles away |  2 out of 5 | |
| Fair Oaks Elementary School KG-6 | 800 Students | 11.2 miles away | Not Yet Rated | |
| Copperopolis Elementary School KG-6 | 273 Students | 11.3 miles away | 5 out of 5 | |
| Roberts Ferry Union Elementary School KG-8 | 110 Students | 12.9 miles away | Not Yet Rated | |
| Valley Home Elementary School KG-8 | 127 Students | 13.3 miles away | Not Yet Rated | |
| Chinese Camp Elementary School KG-6 | 27 Students | 13.3 miles away | Not Yet Rated | - |
| Richard M. Moon Primary School KG-2 | 416 Students | 13.6 miles away | Not Yet Rated | - |
| Lucille Whitehead Intermediate School 3-5 | 403 Students | 13.7 miles away | Not Yet Rated | - |
Compare This School To Nearby Schools ->
School Community Forum

Join a discussion about Knights Ferry Elementary School and talk to others in the community including students, parents, teachers, and administrators.
Popular Discussion Topics
- Admissions and Registration Questions (e.g. Dress Code and Discipline Policy)
- School Calendar and Upcoming Events (e.g. Graduation)
- After School Programs, Extracurricular Activities, and Athletics (e.g. Football)
- News and Announcements (e.g. Yearbook and Class Supply List Details)
- Graduate and Alumni Events (e.g. Organizing Class Reunions)
Navigation
Can't Find What You Are Looking For?
Rankings
Nearby Cities
Sponsored Links
K-12 Articles

Is Your Child Happy at School?
As a parent, you'd love to have your child share all of his feelings with you. It would be so easy...
As a parent, you'd love to have your child share all of his feelings with you. It would be so easy...

Kids and Competition
In the backyard, the classroom, the community and while participating in sports and other...
In the backyard, the classroom, the community and while participating in sports and other...

Teacher Tenure: A Double-Edged Sword
Teacher Tenure (the policy making it almost impossible to fire teachers) has noble roots. It was...
Teacher Tenure (the policy making it almost impossible to fire teachers) has noble roots. It was...