Edwin M Wells Middle School
Rating
Not Available
Not Available

No Reviews Yet
Find Old Friends From Edwin M Wells Middle School
Use the form below to search for alumni from Edwin M Wells Middle School.
School Description
School Summary and Highlights
- Enrolls 1,170 middle school students from grades 6-8
- Ranks 1496th out of 1,763 middle schools in TX.
- 2010 Overall School AYP Met Status: Yes
Additional Contact Information
- Principal or Admin: Cornelius Phelps
- Fax: (281) 586-2637
- Website: www.springisd.org
School Operational Details
- Title I EligibleAll students of this school are eligible for participation in authorized programs.
School District Details
- Spring Independent School District (ISD)
- Per-Pupil Spending: $7,990
- Graduation Rate: 73.0%
- Dropout Rate: 3.0%
- Students Per Teacher: 15.1
- Enrolled Students: 35,350
Faculty Details and Student Enrollment
Students and Faculty
- Total Students Enrolled: 1,170
- Total Full Time "Equivalent" Teachers: 75.2
- Average Student-To-Teacher Ratio: 15.6
Students Gender Breakdown
- Males: 602 (51.5%)
- Females: 568 (48.5%)
Free Lunch Student Eligibility Breakdown
- Eligible for Reduced Lunch: 113 (9.7%)
- Eligible for Free Lunch: 742 (63.4%)
- Eligible for Either Reduced or Free Lunch: 855 (73.1%)
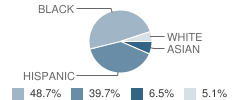
Student Enrollment Distribution by Race / Ethnicity
| Number | Percent | |
|---|---|---|
| American Indian | - | - |
| Black | 570 | 48.7% |
| Asian | 76 | 6.5% |
| Hispanic | 464 | 39.7% |
| White | 60 | 5.1% |
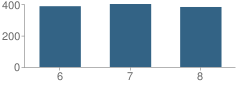
Number of Students Per Grade
| Number | Percent | |
|---|---|---|
| 6th Grade | 387 | 33.1% |
| 7th Grade | 401 | 34.3% |
| 8th Grade | 382 | 32.6% |
Faculty Breakdown (2010)
Average Teacher Experience
School:
6.3
District:
8.4
State:
11.3
Percent of Teachers With 1-5 Years Experience
School:
45.5%
District:
42.8%
State:
31.0%
Percent of Teachers With 6-10 Years Experience
School:
12.0%
District:
20.0%
State:
20.3%
Percent of Teachers With 11-20 Years Experience
School:
12.0%
District:
17.0%
State:
24.4%
Percent of Teachers With Greater Than 20 Years Experience
School:
10.6%
District:
10.3%
State:
18.3%
Faculty Salary (2010)
School Administration Average Base Salary
School:
$76,159
District:
$75,352
State:
$70,209
Teacher Average Base Salary
School:
$48,203
District:
$48,690
State:
$48,263
Beginning Teacher Average Base Salary
School:
$45,126
District:
$42,756
State:
$41,165
Teacher With 1-5 Years Experience Average Base Salary
School:
$45,948
State:
$43,527
Teacher With 6-10 Years Experience Average Base Salary
School:
$47,826
State:
$46,149
Teacher With 11-20 Years Experience Average Base Salary
School:
$52,074
State:
$50,153
Teacher With Greater Than 20 Years Experience Average Base Salary
School:
$59,673
State:
$58,427
Source: TX Department of Education, Source: NCES 2009-2010
School Ratings and Reviews
Be The First To Review Edwin M Wells Middle School!
School Map and Similar Schools Nearby
Click to Activate Map of Nearby School Campuses
Private
Public
This School
Similar Schools Nearby
| Wunderlich Intermediate School 6-8 | 1,393 Students | 2.0 miles away | Not Yet Rated | |
| Kleb Intermediate School 6-8 | 1,012 Students | 2.3 miles away | Not Yet Rated | |
| Strack Intermediate School 6-8 | 1,175 Students | 2.6 miles away | Not Yet Rated | |
| Stelle Claughton Middle School 6-8 | 1,389 Students | 2.8 miles away | Not Yet Rated | |
| Bammel Middle School 6-8 | 1,127 Students | 3.3 miles away | Not Yet Rated | |
| Edward Roberson Middle School 6-8 | 1,069 Students | 3.4 miles away | Not Yet Rated | |
| Doerre Intermediate School 6-8 | 1,320 Students | 3.6 miles away | Not Yet Rated | |
| Shotwell Middle School 7-8 | 1,139 Students | 4.9 miles away | Not Yet Rated | |
| Schindewolf Intermediate School 6-8 | 1,494 Students | 4.9 miles away |  1 out of 5 | |
| Plummer Middle School 7-8 | 935 Students | 5.0 miles away | Not Yet Rated | |
Compare This School To Nearby Schools ->
School Community Forum

Join a discussion about Edwin M Wells Middle School and talk to others in the community including students, parents, teachers, and administrators.
Popular Discussion Topics
- Admissions and Registration Questions (e.g. Dress Code and Discipline Policy)
- School Calendar and Upcoming Events (e.g. Graduation)
- After School Programs, Extracurricular Activities, and Athletics (e.g. Football)
- News and Announcements (e.g. Yearbook and Class Supply List Details)
- Graduate and Alumni Events (e.g. Organizing Class Reunions)
Navigation
Can't Find What You Are Looking For?
Sponsored Links
K-12 Articles

Teacher Tenure: A Double-Edged Sword
Teacher Tenure (the policy making it almost impossible to fire teachers) has noble roots. It was...
Teacher Tenure (the policy making it almost impossible to fire teachers) has noble roots. It was...

School Lunches ... Hot or Cold?
First there were four, now there are six, no one knows how many more there may be in the future....
First there were four, now there are six, no one knows how many more there may be in the future....

Summer Reading
In 1998, a book was published in the US that turned a hatred of reading to love. “Harry Potter and...
In 1998, a book was published in the US that turned a hatred of reading to love. “Harry Potter and...