Spring Valley Middle School
Rating
Not Available
Not Available

3 out of 5 | 4 Reviews
Find Old Friends From Spring Valley Middle School
Use the form below to search for alumni from Spring Valley Middle School.
School Description
School Summary and Highlights
- Enrolls 1,061 middle school students from grades 6-8
- Ranks 1161st out of 2,050 middle schools in CA.
- 2010 Overall School AYP Met Status: No
Additional Contact Information
- Mailing Address: 4750 Date Ave., La Mesa, CA 91941
School District Details
- La Mesa-Spring Valley School District
- Per-Pupil Spending: $9,208
- Students Per Teacher: 21.1
- Enrolled Students: 12,534
Faculty Details and Student Enrollment
Students and Faculty
- Total Students Enrolled: 1,061
- Total Full Time "Equivalent" Teachers: 48.6
- Average Student-To-Teacher Ratio: 21.9
Students Gender Breakdown
- Males: 542 (51.1%)
- Females: 519 (48.9%)
Free Lunch Student Eligibility Breakdown
- Eligible for Reduced Lunch: 141 (13.3%)
- Eligible for Free Lunch: 504 (47.5%)
- Eligible for Either Reduced or Free Lunch: 645 (60.8%)
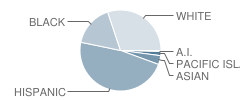
Student Enrollment Distribution by Race / Ethnicity
| Number | Percent | |
|---|---|---|
| American Indian | 6 | 0.6% |
| Black | 167 | 15.7% |
| Asian | 37 | 3.5% |
| Hispanic | 475 | 44.8% |
| White | 301 | 28.4% |
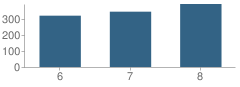
Number of Students Per Grade
| Number | Percent | |
|---|---|---|
| 6th Grade | 321 | 30.3% |
| 7th Grade | 346 | 32.6% |
| 8th Grade | 394 | 37.1% |
Teacher Education Background (2009)
Percent With Ph.D.: 1.5%
Percent With Master's Degree: 34.8%
Percent With Bachelor's Degree: 4.5%
Teacher Credentials & Experience (2009)
Percent of Teachers With Emergency Credentials: 5.4%
Percent of Teachers With Credentials: 91.1%
Number of Certificated Staff: 66.0
Average Number of Years of Teacher Experience: 11.7
Average Age: 40.4
Source: CA Department of Education, Source: NCES 2009-2010
School Ratings and Reviews
Overall Rating: 3

3 out of 5 | 4 Reviews
The Overall Rating is the school's average rating from parents, students, school faculty and staff. The highest rating is five apples and the lowest is one apple.
Share Your Review About This School
4 reviews for Spring Valley Middle School
- Reviewed by Parent/Guardian on October 01, 2010
- Rating:
 (4 / 5) Flag as inappropriate
 - I recently enrolled my 6th and 8th grade daughters in this school and so far I absolutely love it and so do they. My girls have made a lot of friends and the teachers and other staff are very concerned about them being happy and content. So Far So Good!!!!
- Reviewed by Student on November 10, 2009
- Rating:
 (1 / 5) Flag as inappropriate
 - The staff does not care about you, I got cussed out by a teacher because I had a cup of ice! The kids aren't nice and the faculty sucks. Don't send your kid here!
- Reviewed by Student on November 04, 2008
- Rating:
 (5 / 5) Flag as inappropriate
 - i like svms. i like there teachers
- Reviewed by Former Student on September 13, 2008
- Rating: (1 / 5) Flag as inappropriate
- i cant wait to move i hate this school
School Map and Similar Schools Nearby
Click to Activate Map of Nearby School Campuses
Private
Public
This School
Similar Schools Nearby
| Palm Middle School 6-8 | 578 Students | 2.1 miles away | Not Yet Rated | |
| La Mesa Middle School 6-8 | 1,100 Students | 2.4 miles away | Not Yet Rated | |
| Lemon Grove Middle School 6-8 | 527 Students | 2.5 miles away | Not Yet Rated | |
| La Presa Middle School 6-8 | 807 Students | 2.8 miles away |  3 out of 5 | |
| Parkway Middle School 6-8 | 1,242 Students | 2.9 miles away | 3 out of 5 | |
| Vista La Mesa Elementary School KG-6 | 528 Students | 3.2 miles away | Not Yet Rated | |
| San Miguel Elementary School KG-6 | 563 Students | 3.4 miles away | Not Yet Rated | |
| San Altos Elementary School KG-6 | 379 Students | 3.7 miles away | Not Yet Rated | |
| Sunnyside Elementary School KG-6 | 396 Students | 5.5 miles away |  5 out of 5 | |
| Liberty Elementary School KG-6 | 682 Students | 5.9 miles away | Not Yet Rated | |
Compare This School To Nearby Schools ->
School Community Forum

Join a discussion about Spring Valley Middle School and talk to others in the community including students, parents, teachers, and administrators.
Popular Discussion Topics
- Admissions and Registration Questions (e.g. Dress Code and Discipline Policy)
- School Calendar and Upcoming Events (e.g. Graduation)
- After School Programs, Extracurricular Activities, and Athletics (e.g. Football)
- News and Announcements (e.g. Yearbook and Class Supply List Details)
- Graduate and Alumni Events (e.g. Organizing Class Reunions)
Navigation
Can't Find What You Are Looking For?
Rankings
Nearby Cities
Sponsored Links
K-12 Articles

The Cervical Cancer Vaccine
All across North America girls between the ages of 11 and 12 have the opportunity to be vaccinated...
All across North America girls between the ages of 11 and 12 have the opportunity to be vaccinated...

Teach Your Child to Write Well
When American children head off to junior kindergarten, they must be ready to learn. It is your...
When American children head off to junior kindergarten, they must be ready to learn. It is your...

Cell Phones... the Best Thing Since Sliced Bread or the Worst Invention in the World?
Cell phones are wonderful, the best things humans have ever invented! They help us keep in touch...
Cell phones are wonderful, the best things humans have ever invented! They help us keep in touch...