Wheeler School
Rating
Not Available
Not Available

No Reviews Yet
Find Old Friends From Wheeler School
Use the form below to search for alumni from Wheeler School.
School Description
School Summary and Highlights
- Enrolls 397 school students from grades PK-12
- Ranks 803rd out of 1,325 high schools in TX.
- 2010 Overall School AYP Met Status: Yes
Additional Contact Information
- Mailing Address: P O Box 1010, Wheeler, TX 79096
- Principal or Admin: Mr Toby Tucker
- Fax: (806) 826-3118
- Website: www.thestangs.com
School Operational Details
- Title I EligibleAll students of this school are eligible for participation in authorized programs.
School District Details
- Wheeler Independent School District (ISD)
- Per-Pupil Spending: $7,676
- Graduation Rate: 100.0%
- Students Per Teacher: 9.8
- Enrolled Students: 397
Faculty Details and Student Enrollment
Students and Faculty
- Total Students Enrolled: 397
- Total Full Time "Equivalent" Teachers: 40.7
- Average Student-To-Teacher Ratio: 9.8
Students Gender Breakdown
- Males: 207 (52.1%)
- Females: 190 (47.9%)
Free Lunch Student Eligibility Breakdown
- Eligible for Reduced Lunch: 46 (11.6%)
- Eligible for Free Lunch: 172 (43.3%)
- Eligible for Either Reduced or Free Lunch: 218 (54.9%)
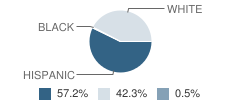
Student Enrollment Distribution by Race / Ethnicity
| Number | Percent | |
|---|---|---|
| American Indian | - | - |
| Black | 2 | 0.5% |
| Asian | - | - |
| Hispanic | 227 | 57.2% |
| White | 168 | 42.3% |
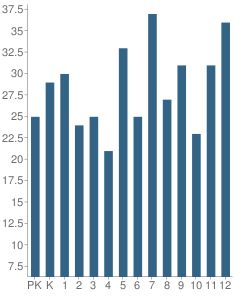
Number of Students Per Grade
| Number | Percent | |
|---|---|---|
| Pre-Kindergarten | 25 | 6.3% |
| Kindergarten | 29 | 7.3% |
| 1st Grade | 30 | 7.6% |
| 2nd Grade | 24 | 6.0% |
| 3rd Grade | 25 | 6.3% |
| 4th Grade | 21 | 5.3% |
| 5th Grade | 33 | 8.3% |
| 6th Grade | 25 | 6.3% |
| 7th Grade | 37 | 9.3% |
| 8th Grade | 27 | 6.8% |
| 9th Grade | 31 | 7.8% |
| 10th Grade | 23 | 5.8% |
| 11th Grade | 31 | 7.8% |
| 12th Grade | 36 | 9.1% |
Breakdown of College Ready Graduates (2009)
Percent Ready For College in Reading
School:
70.0%
District:
70.0%
State:
62.0%
Percent Ready For College in Math
School:
40.0%
District:
60.0%
State:
60.0%
Graduation & Dropout Rates (2009)
Graduation Rate
School:
77.8%
District:
77.8%
State:
80.6%
Dropout Rate
School:
22.2%
District:
22.2%
State:
9.4%
Faculty Salary (2010)
School Administration Average Base Salary
School:
$56,344
District:
$56,344
State:
$70,209
Teacher Average Base Salary
School:
$43,585
District:
$43,585
State:
$48,263
Beginning Teacher Average Base Salary
School:
$34,470
District:
$34,470
State:
$41,165
Teacher With 1-5 Years Experience Average Base Salary
School:
$35,035
State:
$43,527
Teacher With 6-10 Years Experience Average Base Salary
School:
$39,436
State:
$46,149
Teacher With 11-20 Years Experience Average Base Salary
School:
$49,971
State:
$50,153
Teacher With Greater Than 20 Years Experience Average Base Salary
School:
$50,250
State:
$58,427
Faculty Breakdown (2010)
Average Teacher Experience
School:
13.6
District:
13.6
State:
11.3
Percent of Teachers With 1-5 Years Experience
School:
29.5%
District:
29.5%
State:
31.0%
Percent of Teachers With 6-10 Years Experience
School:
12.3%
District:
12.3%
State:
20.3%
Percent of Teachers With 11-20 Years Experience
School:
24.6%
District:
24.6%
State:
24.4%
Percent of Teachers With Greater Than 20 Years Experience
School:
28.7%
District:
28.7%
State:
18.3%
Source: TX Department of Education, Source: NCES 2009-2010
School Ratings and Reviews
Be The First To Review Wheeler School!
School Map and Similar Schools Nearby
Click to Activate Map of Nearby School Campuses
Private
Public
This School
Similar Schools Nearby
| Fort Elliott School PK-12 | 147 Students | 9.4 miles away | Not Yet Rated | |
| Kelton School PK-10 | 156 Students | 9.7 miles away | Not Yet Rated | |
| Shamrock High School 9-12 | 93 Students | 16.4 miles away | Not Yet Rated | |
| Mclean School PK-12 | 220 Students | 23.6 miles away | Not Yet Rated | |
| Miami School PK-12 | 176 Students | 26.5 miles away |  5 out of 5 | |
| Samnorwood School PK-12 | 101 Students | 27.4 miles away | Not Yet Rated | |
| Lefors School PK-12 | 161 Students | 30.0 miles away | Not Yet Rated | |
Compare This School To Nearby Schools ->
School Community Forum

Join a discussion about Wheeler School and talk to others in the community including students, parents, teachers, and administrators.
Popular Discussion Topics
- Admissions and Registration Questions (e.g. Dress Code and Discipline Policy)
- School Calendar and Upcoming Events (e.g. Graduation)
- After School Programs, Extracurricular Activities, and Athletics (e.g. Football)
- News and Announcements (e.g. Yearbook and Class Supply List Details)
- Graduate and Alumni Events (e.g. Organizing Class Reunions)
Navigation
Can't Find What You Are Looking For?
Nearby Cities
Sponsored Links
K-12 Articles

Helping Young Children with Printing and Cursive Writing
Is your child experiencing difficulty printing or writing? Is he unable to print or write legibly,...
Is your child experiencing difficulty printing or writing? Is he unable to print or write legibly,...

Does Your Child's Teacher Make a Difference
School improvement is always in the news. Teachers demand smaller class sizes. The government calls...
School improvement is always in the news. Teachers demand smaller class sizes. The government calls...

School Lunches ... Hot or Cold?
First there were four, now there are six, no one knows how many more there may be in the future....
First there were four, now there are six, no one knows how many more there may be in the future....