Vinewood Elementary School
Rating
Not Available
Not Available

5 out of 5 | 2 Reviews
Find Old Friends From Vinewood Elementary School
Use the form below to search for alumni from Vinewood Elementary School.
School Description
School Summary and Highlights
- Enrolls 540 elementary school students from grades KG-6
- Ranks 1303rd out of 5,423 elementary schools in CA.
- 2010 Overall School AYP Met Status: Yes
Additional Contact Information
- Mailing Address: 1600 West Tokay St., Lodi, CA 95242
School District Details
- Lodi Unified School District
- Per-Pupil Spending: $8,662
- Graduation Rate: 66.6%
- Dropout Rate: 3.0%
- Students Per Teacher: 22.0
- Enrolled Students: 30,860
Faculty Details and Student Enrollment
Students and Faculty
- Total Students Enrolled: 540
- Total Full Time "Equivalent" Teachers: 24.0
- Average Student-To-Teacher Ratio: 22.5
Students Gender Breakdown
- Males: 289 (53.5%)
- Females: 251 (46.5%)
Free Lunch Student Eligibility Breakdown
- Eligible for Reduced Lunch: 52 (9.6%)
- Eligible for Free Lunch: 149 (27.6%)
- Eligible for Either Reduced or Free Lunch: 201 (37.2%)
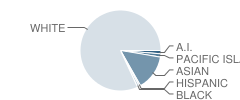
Student Enrollment Distribution by Race / Ethnicity
| Number | Percent | |
|---|---|---|
| American Indian | 6 | 1.1% |
| Black | 4 | 0.7% |
| Asian | 56 | 10.4% |
| Hispanic | 3 | 0.6% |
| White | 320 | 59.3% |
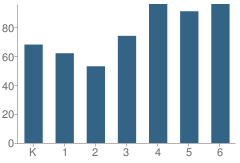
Number of Students Per Grade
| Number | Percent | |
|---|---|---|
| Kindergarten | 68 | 12.6% |
| 1st Grade | 62 | 11.5% |
| 2nd Grade | 53 | 9.8% |
| 3rd Grade | 74 | 13.7% |
| 4th Grade | 96 | 17.8% |
| 5th Grade | 91 | 16.9% |
| 6th Grade | 96 | 17.8% |
Teacher Education Background (2009)
Percent With Master's Degree
School:
22.6%
District:
55.7%
Percent With Bachelor's Degree
School:
3.2%
District:
3.4%
Teacher Credentials & Experience (2009)
Percent of Teachers With Emergency Credentials: 3.6%
Percent of Teachers With Credentials: 96.4%
Number of Certificated Staff: 31.0
Average Number of Years of Teacher Experience: 18.8
Average Age
School:
46.6
District:
47.9
Source: CA Department of Education, Source: NCES 2009-2010
School Ratings and Reviews
Overall Rating: 5

5 out of 5 | 2 Reviews
The Overall Rating is the school's average rating from parents, students, school faculty and staff. The highest rating is five apples and the lowest is one apple.
Share Your Review About This School
2 reviews for Vinewood Elementary School
- Reviewed by Former Student on May 01, 2010
- Rating:
 (5 / 5) Flag as inappropriate
 - no
- Reviewed by Parent/Guardian on January 23, 2009
- Rating: (5 / 5) Flag as inappropriate
- This is a great school with wonderful and dedicated teachers.
School Map and Similar Schools Nearby
Click to Activate Map of Nearby School Campuses
Private
Public
This School
Similar Schools Nearby
| Erma B. Reese Elementary School KG-6 | 635 Students | 0.7 miles away |  5 out of 5 | |
| Leroy Nichols Elementary School KG-6 | 405 Students | 0.8 miles away | Not Yet Rated | |
| Clyde W. Needham Elementary School 4-6 | 280 Students | 1.0 miles away | Not Yet Rated | |
| George Washington Elementary School KG-6 | 457 Students | 1.0 miles away | Not Yet Rated | |
| Lakewood Elementary School KG-6 | 474 Students | 1.4 miles away |  4 out of 5 | |
| Beckman Elementary School KG-6 | 635 Students | 1.6 miles away | Not Yet Rated | |
| Heritage Elementary School KG-6 | 471 Students | 1.7 miles away | Not Yet Rated | |
| Woodbridge School KG-6 | 453 Students | 1.7 miles away | Not Yet Rated | |
| Ellerth E. Larson Elementary School KG-6 | 698 Students | 1.7 miles away | 5 out of 5 | |
| Lawrence Elementary School KG-6 | 539 Students | 1.9 miles away | 5 out of 5 | |
Compare This School To Nearby Schools ->
School Community Forum

Join a discussion about Vinewood Elementary School and talk to others in the community including students, parents, teachers, and administrators.
Popular Discussion Topics
- Admissions and Registration Questions (e.g. Dress Code and Discipline Policy)
- School Calendar and Upcoming Events (e.g. Graduation)
- After School Programs, Extracurricular Activities, and Athletics (e.g. Football)
- News and Announcements (e.g. Yearbook and Class Supply List Details)
- Graduate and Alumni Events (e.g. Organizing Class Reunions)
Navigation
Can't Find What You Are Looking For?
Rankings
Nearby Cities
Sponsored Links
K-12 Articles

What to Do when Your Student is Held Back
Kids develop at different speeds, and everyone has different skills and abilities. School is easy...
Kids develop at different speeds, and everyone has different skills and abilities. School is easy...

National Memories
Few events are seared into our memory, and bring the country together-not as Democrat and...
Few events are seared into our memory, and bring the country together-not as Democrat and...

Promoting Childhood Literacy
The number of American adults who are illiterate is astounding. People who lack the ability to read...
The number of American adults who are illiterate is astounding. People who lack the ability to read...