George Washington Elementary School
Rating
Not Available
Not Available

5 out of 5 | 1 Review
Find Old Friends From George Washington Elementary School
Use the form below to search for alumni from George Washington Elementary School.
School Description
School Summary and Highlights
- Enrolls 714 elementary school students from grades KG-6
- Ranks 4988th out of 5,423 elementary schools in CA.
- 2010 Overall School AYP Met Status: No
Additional Contact Information
- Mailing Address: 509 South St., Madera, CA 93638
School Operational Details
- Title I EligibleAll students of this school are eligible for participation in authorized programs.
School District Details
- Madera Unified School District
- Per-Pupil Spending: $8,490
- Graduation Rate: 71.9%
- Dropout Rate: 5.6%
- Students Per Teacher: 22.8
- Enrolled Students: 19,418
Faculty Details and Student Enrollment
Students and Faculty
- Total Students Enrolled: 714
- Total Full Time "Equivalent" Teachers: 32.0
- Average Student-To-Teacher Ratio: 22.3
Students Gender Breakdown
- Males: 360 (50.4%)
- Females: 354 (49.6%)
Free Lunch Student Eligibility Breakdown
- Eligible for Reduced Lunch: 60 (8.4%)
- Eligible for Free Lunch: 638 (89.4%)
- Eligible for Either Reduced or Free Lunch: 698 (97.8%)
Student Enrollment Distribution by Race / Ethnicity
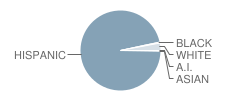
| Number | Percent | |
|---|---|---|
| American Indian | 1 | 0.1% |
| Black | 3 | 0.4% |
| Asian | 1 | 0.1% |
| Hispanic | 686 | 96.1% |
| White | 21 | 2.9% |
Number of Students Per Grade
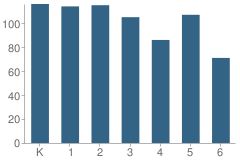
| Number | Percent | |
|---|---|---|
| Kindergarten | 116 | 16.2% |
| 1st Grade | 114 | 16.0% |
| 2nd Grade | 115 | 16.1% |
| 3rd Grade | 105 | 14.7% |
| 4th Grade | 86 | 12.0% |
| 5th Grade | 107 | 15.0% |
| 6th Grade | 71 | 9.9% |
Teacher Education Background (2009)
Percent With Master's Degree
School:
11.4%
District:
30.8%
Percent With Bachelor's Degree
School:
11.4%
District:
7.7%
Teacher Credentials & Experience (2009)
Percent of Teachers With Credentials: 100.0%
Number of Certificated Staff: 35.0
Average Number of Years of Teacher Experience: 11.8
Average Age
School:
40.6
District:
49.5
Source: CA Department of Education, Source: NCES 2009-2010
School Ratings and Reviews
Overall Rating: 5

5 out of 5 | 1 Review
The Overall Rating is the school's average rating from parents, students, school faculty and staff. The highest rating is five apples and the lowest is one apple.
Share Your Review About This School
1 review for George Washington Elementary School
- Reviewed by Student on March 16, 2008
- Rating:
 (5 / 5) Flag as inappropriate
 - I ATTENDED WASHINGTON ELEMENTARY SCHOOL FROM THE 1ST GRADE TO THE 6TH GRADE BACK IN THE 70'S, I HAVE MY FONDEST MEMORIES OF THE EXCELLENT TEACHERS AND STAFF. I ESPECIALLY REMEMBER HOW THE SCHOOL WAS VERY TOUCHED AND SYMPATHETIC WHEN MY FATHER PASSED AWAY WHEN I WAS IN THE 6TH GRADE, I REMEMBER MY 5TH GRADE TEACHER ATTENDED MY FATHERS FUNERAL SERVICE. THANK YOU FOR ALL THE MEMORIES WASHINGTON ELEMENTARY!
School Map and Similar Schools Nearby
Click to Activate Map of Nearby School Campuses
Private
Public
This School
Similar Schools Nearby
| James Monroe Elementary School KG-6 | 768 Students | 1.1 miles away |  3.5 out of 5 | |
| Millview Elementary School KG-6 | 792 Students | 1.1 miles away | Not Yet Rated | |
| James Madison Elementary School KG-6 | 635 Students | 1.2 miles away |  5 out of 5 | |
| John Adams Elementary School KG-6 | 804 Students | 1.3 miles away | Not Yet Rated | |
| John J. Pershing Elementary School KG-6 | 808 Students | 1.4 miles away | Not Yet Rated | - |
| Sierra Vista Elementary School KG-6 | 715 Students | 1.5 miles away | 5 out of 5 | |
| Nishimoto Elementary School KG-6 | 794 Students | 1.6 miles away | Not Yet Rated | |
| Alpha Elementary School KG-6 | 702 Students | 1.8 miles away | Not Yet Rated | |
| Lincoln Elementary School KG-6 | 817 Students | 2.4 miles away | Not Yet Rated | |
| Parkwood Elementary School KG-6 | 793 Students | 2.4 miles away | Not Yet Rated | - |
Compare This School To Nearby Schools ->
School Community Forum

Join a discussion about George Washington Elementary School and talk to others in the community including students, parents, teachers, and administrators.
Popular Discussion Topics
- Admissions and Registration Questions (e.g. Dress Code and Discipline Policy)
- School Calendar and Upcoming Events (e.g. Graduation)
- After School Programs, Extracurricular Activities, and Athletics (e.g. Football)
- News and Announcements (e.g. Yearbook and Class Supply List Details)
- Graduate and Alumni Events (e.g. Organizing Class Reunions)
Navigation
Can't Find What You Are Looking For?
Rankings
Nearby Cities
Sponsored Links
K-12 Articles

Teaching Children with Learning Disabilities to Make Friends
Children with learning disabilities often have trouble making and retaining friendships. Some kids...
Children with learning disabilities often have trouble making and retaining friendships. Some kids...

Strategies to Help Kids Cope with Stress
Many parents believe that kids don’t experience stress. Nothing could be further from the truth....
Many parents believe that kids don’t experience stress. Nothing could be further from the truth....

Choosing a Summer Camp for Your Child
Are you planning to send your child to summer camp this year? If so, have you taken his needs into...
Are you planning to send your child to summer camp this year? If so, have you taken his needs into...