Modesto High School

4.5 out of 5 | 2 Reviews
Find Old Friends From Modesto High School
Use the form below to search for alumni from Modesto High School.
School Description
School Summary and Highlights
- Enrolls 2,933 high school students from grades 9-12
- Ranks 480th out of 1,197 high schools in CA.
- 2010 Overall School AYP Met Status: No
Additional Contact Information
- Mailing Address: 18 H St., Modesto, CA 95351
School Operational Details
- Title I EligibleAll students of this school are eligible for participation in authorized programs.
Faculty Details and Student Enrollment
Students and Faculty
- Total Students Enrolled: 2,933
- Total Full Time "Equivalent" Teachers: 106.8
- Average Student-To-Teacher Ratio: 27.5
Students Gender Breakdown
- Males: 1,481 (50.5%)
- Females: 1,452 (49.5%)
Free Lunch Student Eligibility Breakdown
- Eligible for Reduced Lunch: 236 (8.0%)
- Eligible for Free Lunch: 1,852 (63.1%)
- Eligible for Either Reduced or Free Lunch: 2,088 (71.2%)
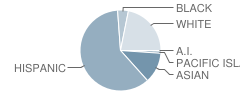
Student Enrollment Distribution by Race / Ethnicity

| Number | Percent | |
|---|---|---|
| American Indian | 11 | 0.4% |
| Black | 126 | 4.3% |
| Asian | 353 | 12.0% |
| Hispanic | 1,727 | 58.9% |
| White | 626 | 21.3% |
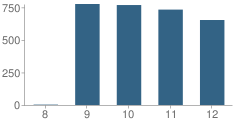
Number of Students Per Grade

| Number | Percent | |
|---|---|---|
| 8th Grade | 3 | 0.1% |
| 9th Grade | 776 | 26.5% |
| 10th Grade | 768 | 26.2% |
| 11th Grade | 733 | 25.0% |
| 12th Grade | 653 | 22.3% |
Graduates Information (2010)
Graduation Rate
School:
79.0%
District:
72.7%
State:
78.6%
Teacher Education Background (2009)
Percent With Ph.D.
School:
2.3%
District:
1.9%
Percent With Master's Degree
School:
6.2%
District:
17.1%
Percent With Bachelor's Degree
School:
6.2%
District:
3.8%
Teacher Credentials & Experience (2009)
Percent of Teachers With Emergency Credentials: 5.2%
Percent of Teachers With Credentials: 99.1%
Number of Certificated Staff: 130.0
Average Number of Years of Teacher Experience: 17.2
Average Age
School:
47.6
District:
49.0
Source: CA Department of Education, Source: NCES 2009-2010
Sponsored Links
Test Scores and Performance Information
Overall School Rating
How is this determined?
The overall school rating shows that Modesto High School performed on average about the same as other schools across the state on CST state exams in the following subjects:
- CST Algebra I
- CST Algebra II
- CST Biology
- CST Chemistry
- CST Earth Science
- CST English-Language Arts
- CST General Mathematics
- CST Geometry
- CST Integrated Math 1
- CST Physics
- CST Science
- CST Summative High School Math
- CST U.S. History
- CST World History
AYP Results (2010)
Overall AYP Met: No
ELA AYP Met: No
Math AYP Met: No
Program Improvement (PI) Requirement Under NCLB (2010)
First Year PI Requirement was Implemented: 2006-2007
School's Placement Under NCLB: Year 5
ACT Exam Results (2009)
Percent of Students Taking ACT Exam: 19.1%
Average Combined Score: 23.7
Percent Scoring At or Above 21: 71.5%
SAT Exam Results (2009)
Percent of Students Taking SAT Exam: 30.4%
Average Combined Score: 1,580.0
Critical Reading Average: 524.7
Math Average: 533.1
Writing Average: 522.1
Percent Scoring At or Above 1500: 61.4%
CST - Test Proficiency by Grade and Subject
Grade 9 - % of students at or above proficiency
| School | District | State | |
|---|---|---|---|
| CST Algebra I Test | |||
| 2010 | 27.0% | 32.0% | 22.0% |
| 2009 | 26.0% | 32.0% | 21.0% |
| 2008 | 32.0% | 36.0% | 18.0% |
| CST Algebra II Test | |||
| 2010 | 80.0% | 79.0% | 69.0% |
| 2009 | 59.0% | 62.0% | 65.0% |
| 2008 | 89.0% | 81.0% | 66.0% |
| CST Earth Science Test | |||
| 2010 | 28.0% | 37.0% | 35.0% |
| 2009 | 26.0% | 31.0% | 29.0% |
| 2008 | 29.0% | 38.0% | 31.0% |
| CST English-Language Arts Test | |||
| 2010 | 54.0% | 58.0% | 54.0% |
| 2009 | 45.0% | 50.0% | 50.0% |
| 2008 | 49.0% | 51.0% | 49.0% |
| CST General Mathematics Test | |||
| 2010 | 6.0% | 9.0% | 17.0% |
| 2009 | 19.0% | 19.0% | 17.0% |
| 2008 | 15.0% | 18.0% | 18.0% |
| CST Geometry Test | |||
| 2010 | 39.0% | 52.0% | 46.0% |
| 2009 | 52.0% | 54.0% | 47.0% |
| 2008 | 60.0% | 57.0% | 43.0% |
| CST Physics Test | |||
| 2010 | 88.0% | 77.0% | 40.0% |
| 2009 | 79.0% | 69.0% | 35.0% |
| 2008 | 86.0% | 75.0% | 30.0% |
| CST World History Test | |||
| 2010 | 91.0% | 87.0% | 45.0% |
| 2009 | 86.0% | 69.0% | 41.0% |
| 2008 | 86.0% | 74.0% | 36.0% |
Grade 10 - % of students at or above proficiency
| School | District | State | |
|---|---|---|---|
| CST Algebra I Test | |||
| 2010 | 11.0% | 19.0% | 12.0% |
| 2009 | 14.0% | 17.0% | 11.0% |
| 2008 | 17.0% | 21.0% | 9.0% |
| CST Algebra II Test | |||
| 2010 | 57.0% | 52.0% | 40.0% |
| 2009 | 58.0% | 45.0% | 37.0% |
| 2008 | 71.0% | 52.0% | 36.0% |
| CST Biology Test | |||
| 2010 | 33.0% | 39.0% | 38.0% |
| 2009 | 30.0% | 33.0% | 34.0% |
| 2008 | 40.0% | 36.0% | 35.0% |
| CST Chemistry Test | |||
| 2010 | 80.0% | 77.0% | 47.0% |
| 2009 | 88.0% | 78.0% | 44.0% |
| 2008 | 84.0% | 73.0% | 41.0% |
| CST English-Language Arts Test | |||
| 2010 | 40.0% | 45.0% | 45.0% |
| 2009 | 42.0% | 42.0% | 44.0% |
| 2008 | 40.0% | 38.0% | 41.0% |
| CST Geometry Test | |||
| 2010 | 15.0% | 18.0% | 14.0% |
| 2009 | 13.0% | 17.0% | 14.0% |
| 2008 | 25.0% | 20.0% | 12.0% |
| CST Science Test | |||
| 2010 | 47.0% | 50.0% | 46.0% |
| 2009 | 45.0% | 43.0% | 44.0% |
| 2008 | 45.0% | 40.0% | 40.0% |
| CST Summative High School Math Test | |||
| 2010 | 75.0% | 82.0% | 75.0% |
| 2009 | 93.0% | 85.0% | 71.0% |
| 2008 | 77.0% | 84.0% | 68.0% |
| CST World History Test | |||
| 2010 | 43.0% | 50.0% | 42.0% |
| 2009 | 40.0% | 44.0% | 38.0% |
| 2008 | 39.0% | 39.0% | 33.0% |
Grade 11 - % of students at or above proficiency
| School | District | State | |
|---|---|---|---|
| CST Algebra I Test | |||
| 2010 | 8.0% | 15.0% | 8.0% |
| 2009 | 10.0% | 11.0% | 8.0% |
| 2008 | 5.0% | 11.0% | 5.0% |
| CST Algebra II Test | |||
| 2010 | 25.0% | 16.0% | 14.0% |
| 2009 | 19.0% | 15.0% | 12.0% |
| 2008 | 38.0% | 22.0% | 11.0% |
| CST Biology Test | |||
| 2010 | 77.0% | 59.0% | 46.0% |
| 2009 | 80.0% | 51.0% | 41.0% |
| 2008 | 76.0% | 56.0% | 39.0% |
| CST Chemistry Test | |||
| 2010 | 14.0% | 40.0% | 30.0% |
| 2009 | 19.0% | 35.0% | 27.0% |
| 2008 | 34.0% | 39.0% | 25.0% |
| CST English-Language Arts Test | |||
| 2010 | 43.0% | 43.0% | 42.0% |
| 2009 | 38.0% | 37.0% | 40.0% |
| 2008 | 37.0% | 37.0% | 37.0% |
| CST Geometry Test | |||
| 2010 | 3.0% | 7.0% | 6.0% |
| 2009 | 7.0% | 7.0% | 7.0% |
| 2008 | 9.0% | 8.0% | 6.0% |
| CST Physics Test | |||
| 2010 | 100.0% | 59.0% | 53.0% |
| CST Summative High School Math Test | |||
| 2010 | 61.0% | 62.0% | 50.0% |
| 2009 | 51.0% | 50.0% | 47.0% |
| 2008 | 51.0% | 49.0% | 43.0% |
| CST U.S. History Test | |||
| 2010 | 47.0% | 51.0% | 45.0% |
| 2009 | 44.0% | 46.0% | 44.0% |
| 2008 | 41.0% | 44.0% | 38.0% |
| CST Earth Science Test | |||
| 2008 | 18.0% | 17.0% | 28.0% |
| CST Integrated Math 1 Test | |||
| 2008 | 13.0% | 22.0% | 9.0% |
| CST World History Test | |||
| 2008 | 11.0% | 7.0% | 9.0% |
End of Course - % of students at or above proficiency
| School | District | State | |
|---|---|---|---|
| CST Algebra I Test | |||
| 2010 | 18.0% | 24.0% | 31.0% |
| 2009 | 16.0% | 23.0% | 28.0% |
| 2008 | 19.0% | 26.0% | 25.0% |
| CST Algebra II Test | |||
| 2010 | 49.0% | 35.0% | 31.0% |
| 2009 | 43.0% | 29.0% | 28.0% |
| 2008 | 62.0% | 38.0% | 27.0% |
| CST Biology Test | |||
| 2010 | 42.0% | 44.0% | 46.0% |
| 2009 | 41.0% | 36.0% | 42.0% |
| 2008 | 47.0% | 39.0% | 42.0% |
| CST Chemistry Test | |||
| 2010 | 40.0% | 51.0% | 38.0% |
| 2009 | 45.0% | 47.0% | 36.0% |
| 2008 | 56.0% | 49.0% | 32.0% |
| CST Earth Science Test | |||
| 2010 | 28.0% | 36.0% | 33.0% |
| 2009 | 26.0% | 31.0% | 28.0% |
| 2008 | 29.0% | 36.0% | 28.0% |
| CST General Mathematics Test | |||
| 2010 | 6.0% | 9.0% | 27.0% |
| 2009 | 19.0% | 19.0% | 26.0% |
| 2008 | 15.0% | 18.0% | 27.0% |
| CST Geometry Test | |||
| 2010 | 18.0% | 25.0% | 27.0% |
| 2009 | 27.0% | 25.0% | 26.0% |
| 2008 | 30.0% | 26.0% | 24.0% |
| CST Physics Test | |||
| 2010 | 90.0% | 75.0% | 49.0% |
| 2009 | 79.0% | 67.0% | 46.0% |
| 2008 | 86.0% | 72.0% | 43.0% |
| CST Summative High School Math Test | |||
| 2010 | 63.0% | 64.0% | 54.0% |
| 2009 | 58.0% | 55.0% | 50.0% |
| 2008 | 53.0% | 51.0% | 47.0% |
| CST World History Test | |||
| 2010 | 50.0% | 51.0% | 41.0% |
| 2009 | 47.0% | 45.0% | 38.0% |
| 2008 | 45.0% | 39.0% | 33.0% |
| CST Integrated Math 1 Test | |||
| 2008 | 13.0% | 22.0% | 11.0% |
Source: CA Department of Education 2009-2010
School Map and Similar Schools Nearby
Click to Activate Map of Nearby School Campuses
Private
Public
This School
Similar Schools Nearby
| Mark Twain Junior High School 7-8 | 650 Students | 0.9 miles away | Not Yet Rated | |
| Roosevelt Junior High School 7-8 | 717 Students | 2.2 miles away | ![]() 5 out of 5 | |
| La Loma Junior High School 7-8 | 532 Students | 2.3 miles away | Not Yet Rated | |
| Thomas Downey High School 9-12 | 2,040 Students | 2.5 miles away | ![]() 5 out of 5 | |
| Grace M. Davis High School 9-12 | 2,646 Students | 3.4 miles away | ![]() 4 out of 5 | |
| Blaker-Kinser Junior High School 7-8 | 813 Students | 3.5 miles away | Not Yet Rated | |
| Ceres High School 9-12 | 1,418 Students | 3.7 miles away | ![]() 4 out of 5 | |
| Mae Hensley Junior High School 7-8 | 982 Students | 3.9 miles away | ![]() 5 out of 5 | |
| Central Valley High School 9-12 | 1,654 Students | 4.5 miles away | Not Yet Rated | |
| Fred C. Beyer High School 9-12 | 2,245 Students | 4.7 miles away | ![]() 4 out of 5 | |
Compare This School To Nearby Schools ->
School Community Forum

Join a discussion about Modesto High School and talk to others in the community including students, parents, teachers, and administrators.
Popular Discussion Topics
- Admissions and Registration Questions (e.g. Dress Code and Discipline Policy)
- School Calendar and Upcoming Events (e.g. Graduation)
- After School Programs, Extracurricular Activities, and Athletics (e.g. Football)
- News and Announcements (e.g. Yearbook and Class Supply List Details)
- Graduate and Alumni Events (e.g. Organizing Class Reunions)
Navigation
Can't Find What You Are Looking For?
Rankings
Nearby Cities
Sponsored Links
K-12 Articles
What to Do when Your Student is Held Back
Kids develop at different speeds, and everyone has different skills and abilities. School is easy...
Beating the Summer Slump
"The Summer Slump", teachers call it. It happens every year. It makes its way into lesson plans...
Keeping Our Kids Safe in the Post 9/11 World
Recently, radio talk show host and CNN personality did a week-long special entitled "The Perfect...


(4 / 5)
(5 / 5) 
