Granada Elementary School
Rating
Not Available
Not Available

4.5 out of 5 | 3 Reviews
Find Old Friends From Granada Elementary School
Use the form below to search for alumni from Granada Elementary School.
School Description
School Summary and Highlights
- Enrolls 544 elementary school students from grades KG-8
- Ranks 803rd out of 2,050 middle schools in CA.
- 2010 Overall School AYP Met Status: No
Additional Contact Information
- Mailing Address: 100 South Granada Ave., Alhambra, CA 91801
School Operational Details
- Title I EligibleAll students of this school are eligible for participation in authorized programs.
School District Details
- Alhambra Unified School District
- Per-Pupil Spending: $9,424
- Graduation Rate: 80.2%
- Dropout Rate: 2.9%
- Students Per Teacher: 25.5
- Enrolled Students: 18,475
Faculty Details and Student Enrollment
Students and Faculty
- Total Students Enrolled: 544
- Total Full Time "Equivalent" Teachers: 25.0
- Average Student-To-Teacher Ratio: 21.8
Students Gender Breakdown
- Males: 263 (48.3%)
- Females: 281 (51.7%)
Free Lunch Student Eligibility Breakdown
- Eligible for Reduced Lunch: 53 (9.7%)
- Eligible for Free Lunch: 333 (61.2%)
- Eligible for Either Reduced or Free Lunch: 386 (71.0%)
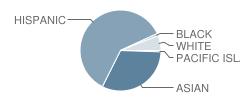
Student Enrollment Distribution by Race / Ethnicity
| Number | Percent | |
|---|---|---|
| American Indian | - | - |
| Black | 5 | 0.9% |
| Asian | 172 | 31.6% |
| Hispanic | 328 | 60.3% |
| White | 32 | 5.9% |
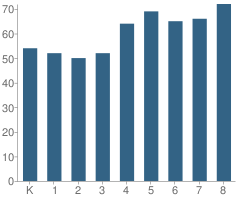
Number of Students Per Grade
| Number | Percent | |
|---|---|---|
| Kindergarten | 54 | 9.9% |
| 1st Grade | 52 | 9.6% |
| 2nd Grade | 50 | 9.2% |
| 3rd Grade | 52 | 9.6% |
| 4th Grade | 64 | 11.8% |
| 5th Grade | 69 | 12.7% |
| 6th Grade | 65 | 11.9% |
| 7th Grade | 66 | 12.1% |
| 8th Grade | 72 | 13.2% |
Teacher Education Background (2009)
Percent With Ph.D.
School:
3.1%
District:
8.6%
Percent With Master's Degree
School:
12.5%
District:
22.9%
Percent With Bachelor's Degree
School:
6.3%
District:
1.4%
Teacher Credentials & Experience (2009)
Percent of Teachers With Credentials: 100.0%
Number of Certificated Staff: 32.0
Average Number of Years of Teacher Experience: 14.1
Average Age
School:
44.8
District:
44.1
Source: CA Department of Education, Source: NCES 2009-2010
School Ratings and Reviews
Overall Rating: 4.5

4.5 out of 5 | 3 Reviews
The Overall Rating is the school's average rating from parents, students, school faculty and staff. The highest rating is five apples and the lowest is one apple.
Share Your Review About This School
3 reviews for Granada Elementary School
- Reviewed by Student on February 27, 2010
- Rating:
 (4 / 5) Flag as inappropriate
 - This is my last year here... the teachers are okay.We don't have alot of funding and as a result we dont have many field trips. Last year the 8th graders went to Dsneyland, this year we're going to Kotts. I went to Kotts when i was in like 4th grade as a field trip and I'm going there as an eigth grader for a field trip? Shows how little funding there is.
- Reviewed by Student on March 22, 2009
- Rating:
 (5 / 5) Flag as inappropriate
 - i go to granada and i love it there
- Reviewed by Student on August 05, 2007
- Rating: (4 / 5) Flag as inappropriate
- This school is okay i say about 35% of the teachers are good. the curriculum is good but there is not much funding for the school resulting in few field trips and poor playgrounds
School Map and Similar Schools Nearby
Click to Activate Map of Nearby School Campuses
Private
Public
This School
Similar Schools Nearby
| Martha Baldwin Elementary School KG-8 | 1,083 Students | 0.6 miles away |  4 out of 5 | |
| Coolidge Elementary School KG-5 | 391 Students | 0.7 miles away | Not Yet Rated | |
| Garfield Elementary School KG-8 | 674 Students | 0.8 miles away | Not Yet Rated | |
| Washington Elementary School KG-5 | 461 Students | 0.9 miles away | Not Yet Rated | |
| William Northrup Elementary School KG-8 | 731 Students | 1.0 miles away |  3 out of 5 | |
| Valentine Elementary School KG-5 | 635 Students | 1.2 miles away | Not Yet Rated | |
| Park Elementary School KG-8 | 723 Students | 1.4 miles away | Not Yet Rated | |
| Mckinley Elementary School KG-5 | 739 Students | 1.6 miles away | Not Yet Rated | |
| Marengo Elementary School KG-5 | 640 Students | 1.7 miles away | Not Yet Rated | |
| Ramona Elementary School KG-8 | 955 Students | 1.8 miles away |  4.5 out of 5 | |
Compare This School To Nearby Schools ->
School Community Forum

Join a discussion about Granada Elementary School and talk to others in the community including students, parents, teachers, and administrators.
Popular Discussion Topics
- Admissions and Registration Questions (e.g. Dress Code and Discipline Policy)
- School Calendar and Upcoming Events (e.g. Graduation)
- After School Programs, Extracurricular Activities, and Athletics (e.g. Football)
- News and Announcements (e.g. Yearbook and Class Supply List Details)
- Graduate and Alumni Events (e.g. Organizing Class Reunions)
Navigation
Can't Find What You Are Looking For?
Rankings
Nearby Cities
Sponsored Links
K-12 Articles

Beating the Summer Slump
“The Summer Slump”, teachers call it. It happens every year. It makes its way into lesson plans...
“The Summer Slump”, teachers call it. It happens every year. It makes its way into lesson plans...

The Impact on Adopted Children at School
Children who are adopted can be affected both academically and socially at school. Many times...
Children who are adopted can be affected both academically and socially at school. Many times...

How to Get the Best Supplies for Your Money
School supply lists can seem unending, and the price can add up very quickly. But do we really...
School supply lists can seem unending, and the price can add up very quickly. But do we really...