Ruhkala Elementary School
Rating
Not Available
Not Available

No Reviews Yet
Find Old Friends From Ruhkala Elementary School
Use the form below to search for alumni from Ruhkala Elementary School.
School Description
School Summary and Highlights
- Enrolls 442 elementary school students from grades KG-6
- Ranks 751st out of 5,423 elementary schools in CA.
- 2010 Overall School AYP Met Status: Yes
School District Details
- Rocklin Unified School District
- Per-Pupil Spending: $7,405
- Graduation Rate: 96.1%
- Dropout Rate: 1.0%
- Students Per Teacher: 21.6
- Enrolled Students: 11,370
Faculty Details and Student Enrollment
Students and Faculty
- Total Students Enrolled: 442
- Total Full Time "Equivalent" Teachers: 20.0
- Average Student-To-Teacher Ratio: 22.1
Students Gender Breakdown
- Males: 230 (52.0%)
- Females: 212 (48.0%)
Free Lunch Student Eligibility Breakdown
- Eligible for Reduced Lunch: 15 (3.4%)
- Eligible for Free Lunch: 28 (6.3%)
- Eligible for Either Reduced or Free Lunch: 43 (9.7%)
Student Enrollment Distribution by Race / Ethnicity

| Number | Percent | |
|---|---|---|
| American Indian | 6 | 1.4% |
| Black | - | - |
| Asian | 11 | 2.5% |
| Hispanic | 12 | 2.7% |
| White | 62 | 14.0% |
Number of Students Per Grade
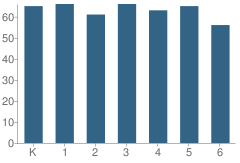
| Number | Percent | |
|---|---|---|
| Kindergarten | 65 | 14.7% |
| 1st Grade | 66 | 14.9% |
| 2nd Grade | 61 | 13.8% |
| 3rd Grade | 66 | 14.9% |
| 4th Grade | 63 | 14.3% |
| 5th Grade | 65 | 14.7% |
| 6th Grade | 56 | 12.7% |
Teacher Education Background (2009)
Percent With Master's Degree
School:
19.2%
District:
30.8%
Percent With Bachelor's Degree
School:
7.7%
District:
15.4%
Teacher Credentials & Experience (2009)
Percent of Teachers With Emergency Credentials: 4.5%
Percent of Teachers With Credentials: 95.5%
Number of Certificated Staff: 26.0
Average Number of Years of Teacher Experience: 10.7
Average Age
School:
39.7
District:
51.3
Source: CA Department of Education, Source: NCES 2009-2010
School Ratings and Reviews
Be The First To Review Ruhkala Elementary School!
School Map and Similar Schools Nearby
Click to Activate Map of Nearby School Campuses
Private
Public
This School
Similar Schools Nearby
| Rock Creek Elementary School KG-6 | 599 Students | 0.6 miles away |  5 out of 5 | |
| Cobblestone Elementary School KG-6 | 495 Students | 1.2 miles away | Not Yet Rated | |
| Twin Oaks Elementary School KG-6 | 495 Students | 1.2 miles away | Not Yet Rated | |
| Thomas Jefferson Elementary School KG-5 | 579 Students | 1.3 miles away | Not Yet Rated | |
| Breen Elementary School KG-6 | 672 Students | 1.7 miles away |  4.5 out of 5 | |
| Vencil Brown Elementary School KG-5 | 485 Students | 1.7 miles away | 5 out of 5 | |
| Catheryn Gates Elementary School KG-5 | 622 Students | 1.9 miles away | Not Yet Rated | |
| Parker Whitney Elementary School KG-6 | 518 Students | 2.0 miles away | 5 out of 5 | |
| Antelope Creek Elementary School KG-6 | 416 Students | 2.4 miles away | Not Yet Rated | |
| Valley View Elementary School KG-6 | 675 Students | 2.5 miles away |  1 out of 5 | |
Compare This School To Nearby Schools ->
School Community Forum

Join a discussion about Ruhkala Elementary School and talk to others in the community including students, parents, teachers, and administrators.
Popular Discussion Topics
- Admissions and Registration Questions (e.g. Dress Code and Discipline Policy)
- School Calendar and Upcoming Events (e.g. Graduation)
- After School Programs, Extracurricular Activities, and Athletics (e.g. Football)
- News and Announcements (e.g. Yearbook and Class Supply List Details)
- Graduate and Alumni Events (e.g. Organizing Class Reunions)
Navigation
Can't Find What You Are Looking For?
Rankings
Nearby Cities
Sponsored Links
K-12 Articles

Helping Your Learning Disabled Child
Thousands of children in America struggle to learn on a daily basis. Many of them have invisible...
Thousands of children in America struggle to learn on a daily basis. Many of them have invisible...

Tips for Purchasing Back to School Supplies
In just a few days, kids from all over the US will be going back to school. Now is the time to take...
In just a few days, kids from all over the US will be going back to school. Now is the time to take...

How to Get the Best Supplies for Your Money
School supply lists can seem unending, and the price can add up very quickly. But do we really...
School supply lists can seem unending, and the price can add up very quickly. But do we really...