Leadership Public Schools - East San Jose
Rating
Not Available
Not Available

No Reviews Yet
Find Old Friends From Leadership Public Schools - East San Jose
Use the form below to search for alumni from Leadership Public Schools - East San Jose.
School Description
School Summary and Highlights
- Enrolls 329 high school students from grades 9-12
- 2010 Overall School AYP Met Status: No
Additional Contact Information
- Mailing Address: 2601 Mission St., 9th Fl., San Francisco, CA 94110
School Operational Details
- Title I Eligible
- Charter School
School District Details
- Santa Clara County Office of Education School District
- Per-Pupil Spending: $48,424
- Graduation Rate: 26.8%
- Dropout Rate: 31.9%
- Students Per Teacher: 13.6
- Enrolled Students: 4,421
Faculty Details and Student Enrollment
Students and Faculty
- Total Students Enrolled: 329
- Total Full Time "Equivalent" Teachers: 15.6
- Average Student-To-Teacher Ratio: 21.1
Students Gender Breakdown
- Males: 156 (47.4%)
- Females: 173 (52.6%)
Free Lunch Student Eligibility Breakdown
- Eligible for Reduced Lunch: 40 (12.2%)
- Eligible for Free Lunch: 219 (66.6%)
- Eligible for Either Reduced or Free Lunch: 259 (78.7%)
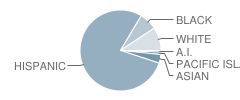
Student Enrollment Distribution by Race / Ethnicity
| Number | Percent | |
|---|---|---|
| American Indian | 3 | 0.9% |
| Black | 24 | 7.3% |
| Asian | 12 | 3.6% |
| Hispanic | 255 | 77.5% |
| White | 31 | 9.4% |
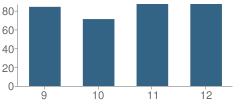
Number of Students Per Grade
| Number | Percent | |
|---|---|---|
| 9th Grade | 84 | 25.5% |
| 10th Grade | 71 | 21.6% |
| 11th Grade | 87 | 26.4% |
| 12th Grade | 87 | 26.4% |
Teacher Education Background (2009)
Percent With Master's Degree
School:
63.6%
District:
27.8%
Percent With Bachelor's Degree
School:
27.3%
District:
2.8%
Teacher Credentials & Experience (2009)
Percent of Teachers With Credentials: 61.1%
Number of Certificated Staff: 22.0
Average Number of Years of Teacher Experience: 6.5
Average Age
School:
33.0
District:
50.1
Source: CA Department of Education, Source: NCES 2009-2010
School Ratings and Reviews
Be The First To Review Leadership Public Schools - East San Jose!
School Map and Similar Schools Nearby
Click to Activate Map of Nearby School Campuses
Private
Public
This School
Similar Schools Nearby
| Latino College Preparatory Academy 9-12 | 330 Students | 2.1 miles away | Not Yet Rated | |
| Kipp San Jose Collegiate School 9-12 | 161 Students | 3.1 miles away | Not Yet Rated | - |
| Escuela Popular / Center for Training and Careers, Family Learning School 9-12 | 1 Students | 3.4 miles away | Not Yet Rated | |
| Escuela Popular Accelerated Family Learning School KG-12 | 316 Students | 3.7 miles away | Not Yet Rated | |
| University Preparatory Academy Charter 7-12 | 324 Students | 3.7 miles away | Not Yet Rated | - |
| San Jose Conservation Corps Charter School 9-12 | 344 Students | 4.7 miles away | Not Yet Rated | - |
| Downtown College Preparatory School 9-12 | 415 Students | 4.7 miles away |  5 out of 5 | |
| South Bay Preparatory School 4-10 | 58 Students | 5.4 miles away | Not Yet Rated | - |
Compare This School To Nearby Schools ->
School Community Forum

Join a discussion about Leadership Public Schools - East San Jose and talk to others in the community including students, parents, teachers, and administrators.
Popular Discussion Topics
- Admissions and Registration Questions (e.g. Dress Code and Discipline Policy)
- School Calendar and Upcoming Events (e.g. Graduation)
- After School Programs, Extracurricular Activities, and Athletics (e.g. Football)
- News and Announcements (e.g. Yearbook and Class Supply List Details)
- Graduate and Alumni Events (e.g. Organizing Class Reunions)
Navigation
Can't Find What You Are Looking For?
Rankings
Sponsored Links
K-12 Articles

Is Your Child's Teacher a Bully?
We've all heard about kids being bullied by peers. Kids taunt, tease, pull hair, shove and push...
We've all heard about kids being bullied by peers. Kids taunt, tease, pull hair, shove and push...

Parent-Teacher Conference Dos and Don'ts
Finals are over and done, and grades have arrived. Now comes the dreaded time to discuss the...
Finals are over and done, and grades have arrived. Now comes the dreaded time to discuss the...

Teaching Kids to Deal with Peer Pressure
Parents usually become very concerned when they hear the term "peer pressure." However, peer...
Parents usually become very concerned when they hear the term "peer pressure." However, peer...