Turlock High School

5 out of 5 | 1 Review
Find Old Friends From Turlock High School
Use the form below to search for alumni from Turlock High School.
School Description
School Summary and Highlights
- Enrolls 2,250 high school students from grades 9-12
- Ranks 276th out of 1,197 high schools in CA.
- 2010 Overall School AYP Met Status: No
Additional Contact Information
- Mailing Address: 1600 East Canal Dr., Turlock, CA 95380
School District Details
- Turlock Unified School District
- Per-Pupil Spending: $8,638
- Graduation Rate: 78.6%
- Dropout Rate: 3.6%
- Students Per Teacher: 21.7
- Enrolled Students: 13,742
Faculty Details and Student Enrollment
Students and Faculty
- Total Students Enrolled: 2,250
- Total Full Time "Equivalent" Teachers: 100.2
- Average Student-To-Teacher Ratio: 22.5
Students Gender Breakdown
- Males: 1,151 (51.2%)
- Females: 1,099 (48.8%)
Free Lunch Student Eligibility Breakdown
- Eligible for Reduced Lunch: 257 (11.4%)
- Eligible for Free Lunch: 1,064 (47.3%)
- Eligible for Either Reduced or Free Lunch: 1,321 (58.7%)
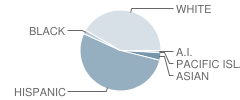
Student Enrollment Distribution by Race / Ethnicity

| Number | Percent | |
|---|---|---|
| American Indian | 17 | 0.8% |
| Black | 36 | 1.6% |
| Asian | 68 | 3.0% |
| Hispanic | 1,163 | 51.7% |
| White | 915 | 40.7% |
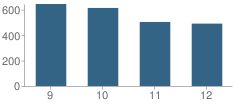
Number of Students Per Grade

| Number | Percent | |
|---|---|---|
| 9th Grade | 644 | 28.6% |
| 10th Grade | 613 | 27.2% |
| 11th Grade | 503 | 22.4% |
| 12th Grade | 490 | 21.8% |
Graduates Information (2010)
Graduation Rate
School:
89.6%
District:
83.1%
State:
78.6%
Teacher Education Background (2009)
Percent With Ph.D.
School:
87.7%
District:
8.7%
Percent With Master's Degree
School:
12.3%
District:
21.7%
Percent With Bachelor's Degree
School:
7.9%
District:
8.7%
Teacher Credentials & Experience (2009)
Percent of Teachers With Emergency Credentials: 3.0%
Percent of Teachers With Credentials: 95.0%
Number of Certificated Staff: 114.0
Average Number of Years of Teacher Experience: 17.4
Average Age
School:
44.5
District:
46.5
Source: CA Department of Education, Source: NCES 2009-2010
Sponsored Links
Test Scores and Performance Information
Overall School Rating
How is this determined?
The overall school rating shows that Turlock High School performed on average better than many other schools across the state on CST state exams in the following subjects:
- CST Algebra I
- CST Algebra II
- CST Biology
- CST Chemistry
- CST Earth Science
- CST English-Language Arts
- CST Geometry
- CST Physics
- CST Science
- CST Summative High School Math
- CST U.S. History
- CST World History
AYP Results (2010)
Overall AYP Met: No
ELA AYP Met: No
Math AYP Met: No
ACT Exam Results (2009)
Percent of Students Taking ACT Exam: 17.1%
Average Combined Score: 22.0
Percent Scoring At or Above 21: 57.0%
SAT Exam Results (2009)
Percent of Students Taking SAT Exam: 27.9%
Average Combined Score: 1,548.5
Critical Reading Average: 514.8
Math Average: 517.2
Writing Average: 516.4
Percent Scoring At or Above 1500: 55.8%
CST - Test Proficiency by Grade and Subject
Grade 9 - % of students at or above proficiency
| School | District | State | |
|---|---|---|---|
| CST Algebra I Test | |||
| 2010 | 18.0% | 18.0% | 22.0% |
| 2009 | 15.0% | 18.0% | 21.0% |
| 2008 | 13.0% | 17.0% | 18.0% |
| CST Algebra II Test | |||
| 2010 | 95.0% | 91.0% | 69.0% |
| 2009 | 92.0% | 80.0% | 65.0% |
| 2008 | 89.0% | 89.0% | 66.0% |
| CST Biology Test | |||
| 2010 | 72.0% | 64.0% | 55.0% |
| 2009 | 67.0% | 42.0% | 51.0% |
| 2008 | 47.0% | 45.0% | 52.0% |
| CST Earth Science Test | |||
| 2010 | 46.0% | 37.0% | 35.0% |
| 2009 | 30.0% | 24.0% | 29.0% |
| 2008 | 21.0% | 18.0% | 31.0% |
| CST English-Language Arts Test | |||
| 2010 | 54.0% | 55.0% | 54.0% |
| 2009 | 47.0% | 52.0% | 50.0% |
| 2008 | 46.0% | 49.0% | 49.0% |
| CST Geometry Test | |||
| 2010 | 68.0% | 54.0% | 46.0% |
| 2009 | 60.0% | 59.0% | 47.0% |
| 2008 | 51.0% | 53.0% | 43.0% |
Grade 10 - % of students at or above proficiency
| School | District | State | |
|---|---|---|---|
| CST Algebra I Test | |||
| 2010 | 19.0% | 16.0% | 12.0% |
| 2009 | 16.0% | 13.0% | 11.0% |
| 2008 | 18.0% | 12.0% | 9.0% |
| CST Algebra II Test | |||
| 2010 | 61.0% | 51.0% | 40.0% |
| 2009 | 50.0% | 53.0% | 37.0% |
| 2008 | 54.0% | 54.0% | 36.0% |
| CST Biology Test | |||
| 2010 | 46.0% | 46.0% | 38.0% |
| 2009 | 40.0% | 33.0% | 34.0% |
| 2008 | 37.0% | 34.0% | 35.0% |
| CST Chemistry Test | |||
| 2010 | 46.0% | 34.0% | 47.0% |
| 2009 | 47.0% | 26.0% | 44.0% |
| 2008 | 29.0% | 30.0% | 41.0% |
| CST Earth Science Test | |||
| 2010 | 38.0% | 30.0% | 29.0% |
| 2009 | 16.0% | 12.0% | 23.0% |
| 2008 | 21.0% | 24.0% | 23.0% |
| CST English-Language Arts Test | |||
| 2010 | 44.0% | 46.0% | 45.0% |
| 2009 | 38.0% | 40.0% | 44.0% |
| 2008 | 45.0% | 41.0% | 41.0% |
| CST Geometry Test | |||
| 2010 | 36.0% | 24.0% | 14.0% |
| 2009 | 26.0% | 23.0% | 14.0% |
| 2008 | 20.0% | 15.0% | 12.0% |
| CST Science Test | |||
| 2010 | 44.0% | 42.0% | 46.0% |
| 2009 | 45.0% | 39.0% | 44.0% |
| 2008 | 37.0% | 32.0% | 40.0% |
| CST World History Test | |||
| 2010 | 40.0% | 43.0% | 42.0% |
| 2009 | 35.0% | 36.0% | 38.0% |
| 2008 | 33.0% | 35.0% | 33.0% |
| CST Summative High School Math Test | |||
| 2009 | 85.0% | 87.0% | 71.0% |
| 2008 | 83.0% | 85.0% | 68.0% |
Grade 11 - % of students at or above proficiency
| School | District | State | |
|---|---|---|---|
| CST Algebra I Test | |||
| 2010 | 19.0% | 12.0% | 8.0% |
| 2009 | 13.0% | 8.0% | 8.0% |
| 2008 | 14.0% | 9.0% | 5.0% |
| CST Algebra II Test | |||
| 2010 | 43.0% | 31.0% | 14.0% |
| 2009 | 25.0% | 26.0% | 12.0% |
| 2008 | 45.0% | 38.0% | 11.0% |
| CST Biology Test | |||
| 2010 | 49.0% | 52.0% | 46.0% |
| 2009 | 51.0% | 40.0% | 41.0% |
| 2008 | 31.0% | 33.0% | 39.0% |
| CST Chemistry Test | |||
| 2010 | 26.0% | 27.0% | 30.0% |
| 2009 | 26.0% | 20.0% | 27.0% |
| 2008 | 27.0% | 27.0% | 25.0% |
| CST Earth Science Test | |||
| 2010 | 26.0% | 20.0% | 32.0% |
| 2009 | 34.0% | 16.0% | 26.0% |
| 2008 | 20.0% | 16.0% | 28.0% |
| CST English-Language Arts Test | |||
| 2010 | 50.0% | 43.0% | 42.0% |
| 2009 | 40.0% | 36.0% | 40.0% |
| 2008 | 37.0% | 33.0% | 37.0% |
| CST Geometry Test | |||
| 2010 | 33.0% | 19.0% | 6.0% |
| 2009 | 15.0% | 11.0% | 7.0% |
| 2008 | 11.0% | 12.0% | 6.0% |
| CST Physics Test | |||
| 2010 | 93.0% | 69.0% | 53.0% |
| CST Summative High School Math Test | |||
| 2010 | 75.0% | 64.0% | 50.0% |
| 2009 | 56.0% | 48.0% | 47.0% |
| 2008 | 54.0% | 51.0% | 43.0% |
| CST U.S. History Test | |||
| 2010 | 55.0% | 48.0% | 45.0% |
| 2009 | 49.0% | 45.0% | 44.0% |
| 2008 | 39.0% | 38.0% | 38.0% |
End of Course - % of students at or above proficiency
| School | District | State | |
|---|---|---|---|
| CST Algebra I Test | |||
| 2010 | 18.0% | 25.0% | 31.0% |
| 2009 | 15.0% | 23.0% | 28.0% |
| 2008 | 15.0% | 20.0% | 25.0% |
| CST Algebra II Test | |||
| 2010 | 57.0% | 45.0% | 31.0% |
| 2009 | 41.0% | 43.0% | 28.0% |
| 2008 | 54.0% | 49.0% | 27.0% |
| CST Biology Test | |||
| 2010 | 54.0% | 53.0% | 46.0% |
| 2009 | 49.0% | 38.0% | 42.0% |
| 2008 | 39.0% | 38.0% | 42.0% |
| CST Chemistry Test | |||
| 2010 | 32.0% | 30.0% | 38.0% |
| 2009 | 34.0% | 23.0% | 36.0% |
| 2008 | 28.0% | 29.0% | 32.0% |
| CST Earth Science Test | |||
| 2010 | 36.0% | 28.0% | 33.0% |
| 2009 | 28.0% | 17.0% | 28.0% |
| 2008 | 21.0% | 18.0% | 28.0% |
| CST Geometry Test | |||
| 2010 | 45.0% | 35.0% | 27.0% |
| 2009 | 30.0% | 31.0% | 26.0% |
| 2008 | 25.0% | 26.0% | 24.0% |
| CST Physics Test | |||
| 2010 | 93.0% | 57.0% | 49.0% |
| CST Summative High School Math Test | |||
| 2010 | 79.0% | 71.0% | 54.0% |
| 2009 | 62.0% | 55.0% | 50.0% |
| 2008 | 60.0% | 58.0% | 47.0% |
| CST World History Test | |||
| 2010 | 40.0% | 42.0% | 41.0% |
| 2009 | 35.0% | 36.0% | 38.0% |
| 2008 | 32.0% | 33.0% | 33.0% |
Source: CA Department of Education 2009-2010
School Map and Similar Schools Nearby
Click to Activate Map of Nearby School Campuses
Private
Public
This School
Similar Schools Nearby
| Denair High School 9-12 | 355 Students | 2.1 miles away | Not Yet Rated | |
| Turlock Junior High School 7-8 | 1,315 Students | 3.0 miles away | Not Yet Rated | |
| John H. Pitman High School 9-12 | 2,207 Students | 3.5 miles away | Not Yet Rated | |
| Delhi High School 9-12 | 682 Students | 5.4 miles away | Not Yet Rated | |
| Hilmar High School 9-12 | 699 Students | 6.8 miles away | ![]() 5 out of 5 | |
| Hughson High School 9-12 | 758 Students | 6.8 miles away | Not Yet Rated | |
| Central Valley High School 9-12 | 1,654 Students | 9.0 miles away | Not Yet Rated | |
| Mae Hensley Junior High School 7-8 | 982 Students | 9.7 miles away | ![]() 5 out of 5 | |
| Ceres High School 9-12 | 1,418 Students | 9.8 miles away | ![]() 4 out of 5 | |
| Waterford High School 9-12 | 613 Students | 9.8 miles away | Not Yet Rated | |
Compare This School To Nearby Schools ->
School Community Forum

Join a discussion about Turlock High School and talk to others in the community including students, parents, teachers, and administrators.
Popular Discussion Topics
- Admissions and Registration Questions (e.g. Dress Code and Discipline Policy)
- School Calendar and Upcoming Events (e.g. Graduation)
- After School Programs, Extracurricular Activities, and Athletics (e.g. Football)
- News and Announcements (e.g. Yearbook and Class Supply List Details)
- Graduate and Alumni Events (e.g. Organizing Class Reunions)
Navigation
Can't Find What You Are Looking For?
Rankings
Nearby Cities
Sponsored Links
K-12 Articles
School Lunches ... Hot or Cold?
First there were four, now there are six, no one knows how many more there may be in the future....
Assisting Students to Overcome Test Anxiety
Every human copes with anxiety at one time or another. It is a basic emotion that we feel when...
The Difference Between Boys and Girls
Boys and girls are different. Give a toddler girl a G.I. Joe and she'll probably try to mother it....


(5 / 5) 
