Seaside High School

5 out of 5 | 1 Review
Find Old Friends From Seaside High School
Use the form below to search for alumni from Seaside High School.
School Description
School Summary and Highlights
- Enrolls 1,207 high school students from grades 9-12
- Ranks 952nd out of 1,197 high schools in CA.
- 2010 Overall School AYP Met Status: No
Additional Contact Information
- Mailing Address: 2200 Noche Buena St., Seaside, CA 93955
School District Details
- Monterey Peninsula Unified School District
- Per-Pupil Spending: $8,701
- Graduation Rate: 59.2%
- Dropout Rate: 2.4%
- Students Per Teacher: 23.8
- Enrolled Students: 11,624
Faculty Details and Student Enrollment
Students and Faculty
- Total Students Enrolled: 1,207
- Total Full Time "Equivalent" Teachers: 50.0
- Average Student-To-Teacher Ratio: 24.1
Students Gender Breakdown
- Males: 580 (48.1%)
- Females: 627 (51.9%)
Free Lunch Student Eligibility Breakdown
- Eligible for Reduced Lunch: 149 (12.3%)
- Eligible for Free Lunch: 487 (40.3%)
- Eligible for Either Reduced or Free Lunch: 636 (52.7%)
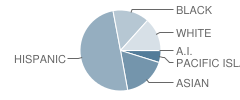
Student Enrollment Distribution by Race / Ethnicity

| Number | Percent | |
|---|---|---|
| American Indian | 1 | 0.08% |
| Black | 172 | 14.3% |
| Asian | 204 | 16.9% |
| Hispanic | 586 | 48.6% |
| White | 157 | 13.0% |
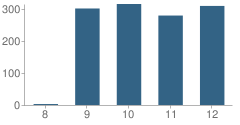
Number of Students Per Grade

| Number | Percent | |
|---|---|---|
| 8th Grade | 3 | 0.2% |
| 9th Grade | 301 | 24.9% |
| 10th Grade | 315 | 26.1% |
| 11th Grade | 279 | 23.1% |
| 12th Grade | 309 | 25.6% |
Graduates Information (2010)
Graduation Rate
School:
88.4%
District:
87.0%
State:
78.6%
Teacher Education Background (2009)
Percent With Ph.D.
School:
4.6%
District:
4.3%
Percent With Master's Degree
School:
24.6%
District:
13.0%
Percent With Bachelor's Degree
School:
6.2%
District:
23.9%
Teacher Credentials & Experience (2009)
Percent of Teachers With Emergency Credentials: 16.7%
Percent of Teachers With Credentials: 96.7%
Number of Certificated Staff: 65.0
Average Number of Years of Teacher Experience: 6.0
Average Age
School:
47.5
District:
44.6
Source: CA Department of Education, Source: NCES 2009-2010
Sponsored Links
Test Scores and Performance Information
Overall School Rating
How is this determined?
The overall school rating shows that Seaside High School performed on average worse than many other schools across the state on CST state exams in the following subjects:
- CST Algebra I
- CST Algebra II
- CST Biology
- CST Chemistry
- CST Earth Science
- CST English-Language Arts
- CST Geometry
- CST Physics
- CST Science
- CST Summative High School Math
- CST U.S. History
- CST World History
AYP Results (2010)
Overall AYP Met: No
ELA AYP Met: No
Math AYP Met: No
ACT Exam Results (2009)
Percent of Students Taking ACT Exam: 7.7%
Average Combined Score: 21.8
Percent Scoring At or Above 21: 54.2%
SAT Exam Results (2009)
Percent of Students Taking SAT Exam: 31.6%
Average Combined Score: 1,419.5
Critical Reading Average: 470.4
Math Average: 486.6
Writing Average: 462.5
Percent Scoring At or Above 1500: 34.7%
CST - Test Proficiency by Grade and Subject
Grade 9 - % of students at or above proficiency
| School | District | State | |
|---|---|---|---|
| CST Algebra I Test | |||
| 2010 | 14.0% | 14.0% | 22.0% |
| 2009 | 9.0% | 11.0% | 21.0% |
| 2008 | 7.0% | 11.0% | 18.0% |
| CST Biology Test | |||
| 2010 | 29.0% | 55.0% | 55.0% |
| 2009 | 55.0% | 66.0% | 51.0% |
| 2008 | 75.0% | 68.0% | 52.0% |
| CST Earth Science Test | |||
| 2010 | 18.0% | 23.0% | 35.0% |
| 2009 | 23.0% | 20.0% | 29.0% |
| 2008 | 25.0% | 25.0% | 31.0% |
| CST English-Language Arts Test | |||
| 2010 | 41.0% | 50.0% | 54.0% |
| 2009 | 36.0% | 45.0% | 50.0% |
| 2008 | 39.0% | 48.0% | 49.0% |
| CST Geometry Test | |||
| 2010 | 22.0% | 26.0% | 46.0% |
| 2009 | 22.0% | 44.0% | 47.0% |
| 2008 | 11.0% | 52.0% | 43.0% |
Grade 10 - % of students at or above proficiency
| School | District | State | |
|---|---|---|---|
| CST Algebra I Test | |||
| 2010 | 6.0% | 7.0% | 12.0% |
| 2009 | - | - | - |
| 2008 | 5.0% | 5.0% | 9.0% |
| CST Algebra II Test | |||
| 2010 | 29.0% | 34.0% | 40.0% |
| 2009 | 9.0% | 29.0% | 37.0% |
| 2008 | 23.0% | 42.0% | 36.0% |
| CST Biology Test | |||
| 2010 | 23.0% | 29.0% | 38.0% |
| 2009 | 27.0% | 30.0% | 34.0% |
| 2008 | 42.0% | 39.0% | 35.0% |
| CST Chemistry Test | |||
| 2010 | 50.0% | 48.0% | 47.0% |
| 2009 | 70.0% | 56.0% | 44.0% |
| 2008 | 60.0% | 61.0% | 41.0% |
| CST Earth Science Test | |||
| 2010 | 12.0% | 16.0% | 29.0% |
| 2009 | 3.0% | 11.0% | 23.0% |
| 2008 | 17.0% | 17.0% | 23.0% |
| CST English-Language Arts Test | |||
| 2010 | 40.0% | 46.0% | 45.0% |
| 2009 | 34.0% | 41.0% | 44.0% |
| 2008 | 28.0% | 39.0% | 41.0% |
| CST Geometry Test | |||
| 2010 | 5.0% | 7.0% | 14.0% |
| 2009 | 6.0% | 8.0% | 14.0% |
| 2008 | 4.0% | 10.0% | 12.0% |
| CST Science Test | |||
| 2010 | 30.0% | 42.0% | 46.0% |
| 2009 | 31.0% | 41.0% | 44.0% |
| 2008 | 26.0% | 40.0% | 40.0% |
| CST World History Test | |||
| 2010 | 21.0% | 32.0% | 42.0% |
| 2009 | 23.0% | 36.0% | 38.0% |
| 2008 | 19.0% | 32.0% | 33.0% |
Grade 11 - % of students at or above proficiency
| School | District | State | |
|---|---|---|---|
| CST Algebra II Test | |||
| 2010 | 5.0% | 5.0% | 14.0% |
| 2009 | 7.0% | 11.0% | 12.0% |
| 2008 | 9.0% | 9.0% | 11.0% |
| CST Biology Test | |||
| 2010 | 11.0% | 41.0% | 46.0% |
| 2009 | 19.0% | 38.0% | 41.0% |
| 2008 | 30.0% | 56.0% | 39.0% |
| CST Chemistry Test | |||
| 2010 | 32.0% | 26.0% | 30.0% |
| 2009 | 47.0% | 37.0% | 27.0% |
| 2008 | 48.0% | 42.0% | 25.0% |
| CST English-Language Arts Test | |||
| 2010 | 38.0% | 42.0% | 42.0% |
| 2009 | 31.0% | 41.0% | 40.0% |
| 2008 | 30.0% | 35.0% | 37.0% |
| CST Geometry Test | |||
| 2010 | 3.0% | 1.0% | 6.0% |
| 2009 | 4.0% | 4.0% | 7.0% |
| CST Physics Test | |||
| 2010 | 22.0% | 51.0% | 53.0% |
| 2009 | 23.0% | 71.0% | 50.0% |
| CST Summative High School Math Test | |||
| 2010 | 28.0% | 39.0% | 50.0% |
| 2009 | 7.0% | 39.0% | 47.0% |
| 2008 | 14.0% | 28.0% | 43.0% |
| CST U.S. History Test | |||
| 2010 | 26.0% | 42.0% | 45.0% |
| 2009 | 24.0% | 43.0% | 44.0% |
| 2008 | 30.0% | 37.0% | 38.0% |
| CST Earth Science Test | |||
| 2009 | 16.0% | 14.0% | 26.0% |
| 2008 | 31.0% | 24.0% | 28.0% |
| CST Algebra I Test | |||
| 2008 | 6.0% | 6.0% | 5.0% |
End of Course - % of students at or above proficiency
| School | District | State | |
|---|---|---|---|
| CST Algebra I Test | |||
| 2010 | 11.0% | 31.0% | 31.0% |
| 2009 | 6.0% | 25.0% | 28.0% |
| 2008 | 6.0% | 19.0% | 25.0% |
| CST Algebra II Test | |||
| 2010 | 18.0% | 21.0% | 31.0% |
| 2009 | 8.0% | 19.0% | 28.0% |
| 2008 | 15.0% | 28.0% | 27.0% |
| CST Biology Test | |||
| 2010 | 23.0% | 43.0% | 46.0% |
| 2009 | 33.0% | 47.0% | 42.0% |
| 2008 | 46.0% | 55.0% | 42.0% |
| CST Chemistry Test | |||
| 2010 | 40.0% | 39.0% | 38.0% |
| 2009 | 55.0% | 47.0% | 36.0% |
| 2008 | 50.0% | 52.0% | 32.0% |
| CST Earth Science Test | |||
| 2010 | 16.0% | 23.0% | 33.0% |
| 2009 | 17.0% | 17.0% | 28.0% |
| 2008 | 24.0% | 23.0% | 28.0% |
| CST Geometry Test | |||
| 2010 | 11.0% | 15.0% | 27.0% |
| 2009 | 10.0% | 20.0% | 26.0% |
| 2008 | 4.0% | 23.0% | 24.0% |
| CST Physics Test | |||
| 2010 | 25.0% | 51.0% | 49.0% |
| 2009 | 23.0% | 71.0% | 46.0% |
| CST Summative High School Math Test | |||
| 2010 | 28.0% | 40.0% | 54.0% |
| 2009 | 10.0% | 43.0% | 50.0% |
| 2008 | 14.0% | 31.0% | 47.0% |
| CST World History Test | |||
| 2010 | 21.0% | 32.0% | 41.0% |
| 2009 | 21.0% | 34.0% | 38.0% |
| 2008 | 19.0% | 31.0% | 33.0% |
Source: CA Department of Education 2009-2010
School Map and Similar Schools Nearby
Click to Activate Map of Nearby School Campuses
Private
Public
This School
Similar Schools Nearby
| Monterey High School 9-12 | 1,372 Students | 4.0 miles away | ![]() 5 out of 5 | |
| Marina High School 9-12 | 494 Students | 4.3 miles away | Not Yet Rated | |
| Pacific Grove Middle School 5-9 | 406 Students | 4.6 miles away | Not Yet Rated | |
| Pacific Grove High School 9-12 | 471 Students | 4.8 miles away | Not Yet Rated | |
| Carmel High School 9-12 | 726 Students | 6.1 miles away | Not Yet Rated | |
| Salinas High School 9-12 | 2,563 Students | 10.6 miles away | Not Yet Rated | |
| North Salinas High School 9-12 | 2,047 Students | 12.2 miles away | Not Yet Rated | |
| Everett Alvarez High School 9-12 | 2,132 Students | 13.6 miles away | Not Yet Rated | |
| Alisal High School 9-12 | 2,422 Students | 14.2 miles away | ![]() 5 out of 5 | |
| Gonzales High School 9-12 | 700 Students | 23.4 miles away | ![]() 3.5 out of 5 | |
Compare This School To Nearby Schools ->
School Community Forum

Join a discussion about Seaside High School and talk to others in the community including students, parents, teachers, and administrators.
Popular Discussion Topics
- Admissions and Registration Questions (e.g. Dress Code and Discipline Policy)
- School Calendar and Upcoming Events (e.g. Graduation)
- After School Programs, Extracurricular Activities, and Athletics (e.g. Football)
- News and Announcements (e.g. Yearbook and Class Supply List Details)
- Graduate and Alumni Events (e.g. Organizing Class Reunions)
Navigation
Can't Find What You Are Looking For?
Rankings
Nearby Cities
Sponsored Links
K-12 Articles
Teaching Your Child Study Skills
Many children who have the capability to get good grades experience frustration because of low...
Se Hablan Otras Idiomas?
In the late 1990s, the Salem-Keizer school district in Oregon began requiring every student in its...
Parent and Family Involvement in School
When visiting my grandson's school, I often hear administrators and teachers complaining that not...


(5 / 5) 
