El Cerrito High School

No Reviews Yet
Find Old Friends From El Cerrito High School
Use the form below to search for alumni from El Cerrito High School.
School Description
School Summary and Highlights
- Enrolls 1,243 high school students from grades 9-12
- Ranks 1037th out of 1,197 high schools in CA.
- 2010 Overall School AYP Met Status: No
Additional Contact Information
- Mailing Address: 540 Ashbury Ave., El Cerrito, CA 94530
School District Details
- West Contra Costa Unified School District
- Per-Pupil Spending: $9,943
- Graduation Rate: 61.2%
- Dropout Rate: 5.6%
- Students Per Teacher: 20.9
- Enrolled Students: 29,881
Faculty Details and Student Enrollment
Students and Faculty
- Total Students Enrolled: 1,243
- Total Full Time "Equivalent" Teachers: 54.5
- Average Student-To-Teacher Ratio: 22.8
Students Gender Breakdown
- Males: 657 (52.9%)
- Females: 586 (47.1%)
Free Lunch Student Eligibility Breakdown
- Eligible for Reduced Lunch: 95 (7.6%)
- Eligible for Free Lunch: 431 (34.7%)
- Eligible for Either Reduced or Free Lunch: 526 (42.3%)
Student Enrollment Distribution by Race / Ethnicity
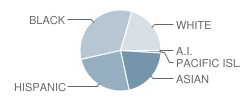
| Number | Percent | |
|---|---|---|
| American Indian | 3 | 0.2% |
| Black | 409 | 32.9% |
| Asian | 256 | 20.6% |
| Hispanic | 309 | 24.9% |
| White | 254 | 20.4% |
Number of Students Per Grade
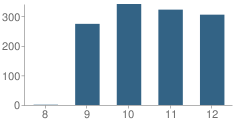
| Number | Percent | |
|---|---|---|
| 8th Grade | 1 | 0.08% |
| 9th Grade | 274 | 22.0% |
| 10th Grade | 341 | 27.4% |
| 11th Grade | 322 | 25.9% |
| 12th Grade | 305 | 24.5% |
Graduates Information (2010)
Graduation Rate
School:
90.5%
District:
74.2%
State:
78.6%
Teacher Education Background (2009)
Percent With Master's Degree
School:
28.3%
District:
25.4%
Percent With Bachelor's Degree
School:
21.7%
District:
11.2%
Teacher Credentials & Experience (2009)
Percent of Teachers With Emergency Credentials: 7.5%
Percent of Teachers With Credentials: 90.6%
Number of Certificated Staff: 60.0
Average Number of Years of Teacher Experience: 14.7
Average Age
School:
45.5
District:
49.4
Source: CA Department of Education, Source: NCES 2009-2010
School Ratings and Reviews
Be The First To Review El Cerrito High School!
Sponsored Links
Test Scores and Performance Information
Overall School Rating
How is this determined?
The overall school rating shows that El Cerrito High School performed on average worse than many other schools across the state on CST state exams in the following subjects:
- CST Algebra I
- CST Algebra II
- CST Biology
- CST Chemistry
- CST Earth Science
- CST English-Language Arts
- CST Geometry
- CST Physics
- CST Science
- CST Summative High School Math
- CST U.S. History
- CST World History
AYP Results (2010)
Overall AYP Met: No
ELA AYP Met: No
Math AYP Met: No
ACT Exam Results (2009)
Percent of Students Taking ACT Exam: 23.2%
Average Combined Score: 20.5
Percent Scoring At or Above 21: 46.0%
SAT Exam Results (2009)
Percent of Students Taking SAT Exam: 54.0%
Average Combined Score: 1,460.7
Critical Reading Average: 480.8
Math Average: 504.7
Writing Average: 475.2
Percent Scoring At or Above 1500: 48.3%
CST - Test Proficiency by Grade and Subject
Grade 9 - % of students at or above proficiency
| School | District | State | |
|---|---|---|---|
| CST Algebra I Test | |||
| 2010 | 1.0% | 6.0% | 22.0% |
| 2009 | 2.0% | 5.0% | 21.0% |
| 2008 | 5.0% | 4.0% | 18.0% |
| CST Algebra II Test | |||
| 2010 | 43.0% | 43.0% | 69.0% |
| 2009 | - | - | - |
| 2008 | 33.0% | 34.0% | 66.0% |
| CST Biology Test | |||
| 2010 | 37.0% | 31.0% | 55.0% |
| 2009 | 23.0% | 31.0% | 51.0% |
| 2008 | 28.0% | 35.0% | 52.0% |
| CST English-Language Arts Test | |||
| 2010 | 54.0% | 39.0% | 54.0% |
| 2009 | 46.0% | 36.0% | 50.0% |
| 2008 | 43.0% | 36.0% | 49.0% |
| CST Geometry Test | |||
| 2010 | 30.0% | 22.0% | 46.0% |
| 2009 | 18.0% | 19.0% | 47.0% |
| 2008 | 12.0% | 21.0% | 43.0% |
Grade 10 - % of students at or above proficiency
| School | District | State | |
|---|---|---|---|
| CST Algebra I Test | |||
| 2010 | 2.0% | 3.0% | 12.0% |
| CST Algebra II Test | |||
| 2010 | 14.0% | 8.0% | 40.0% |
| 2009 | 17.0% | 13.0% | 37.0% |
| 2008 | 14.0% | 17.0% | 36.0% |
| CST Biology Test | |||
| 2010 | 5.0% | 16.0% | 38.0% |
| 2009 | 7.0% | 20.0% | 34.0% |
| 2008 | 11.0% | 15.0% | 35.0% |
| CST Chemistry Test | |||
| 2010 | 9.0% | 14.0% | 47.0% |
| 2009 | 10.0% | 20.0% | 44.0% |
| 2008 | 28.0% | 22.0% | 41.0% |
| CST English-Language Arts Test | |||
| 2010 | 32.0% | 30.0% | 45.0% |
| 2009 | 39.0% | 31.0% | 44.0% |
| 2008 | 38.0% | 28.0% | 41.0% |
| CST Geometry Test | |||
| 2010 | 1.0% | 4.0% | 14.0% |
| 2009 | 2.0% | 3.0% | 14.0% |
| 2008 | 1.0% | 4.0% | 12.0% |
| CST Science Test | |||
| 2010 | 31.0% | 27.0% | 46.0% |
| 2009 | 33.0% | 29.0% | 44.0% |
| 2008 | 31.0% | 24.0% | 40.0% |
| CST Summative High School Math Test | |||
| 2010 | 45.0% | 46.0% | 75.0% |
| 2009 | 64.0% | 59.0% | 71.0% |
| 2008 | 74.0% | 66.0% | 68.0% |
| CST World History Test | |||
| 2010 | 18.0% | 22.0% | 42.0% |
| 2009 | 26.0% | 21.0% | 38.0% |
| 2008 | 29.0% | 20.0% | 33.0% |
| CST Earth Science Test | |||
| 2008 | 9.0% | 8.0% | 23.0% |
Grade 11 - % of students at or above proficiency
| School | District | State | |
|---|---|---|---|
| CST Algebra I Test | |||
| 2010 | 5.0% | 2.0% | 8.0% |
| 2009 | 4.0% | 1.0% | 8.0% |
| CST Algebra II Test | |||
| 2010 | 4.0% | 2.0% | 14.0% |
| 2009 | 2.0% | 2.0% | 12.0% |
| 2008 | 2.0% | 3.0% | 11.0% |
| CST Chemistry Test | |||
| 2010 | 8.0% | 13.0% | 30.0% |
| 2009 | 4.0% | 9.0% | 27.0% |
| 2008 | 3.0% | 7.0% | 25.0% |
| CST English-Language Arts Test | |||
| 2010 | 39.0% | 29.0% | 42.0% |
| 2009 | 39.0% | 28.0% | 40.0% |
| 2008 | 35.0% | 28.0% | 37.0% |
| CST Physics Test | |||
| 2010 | 54.0% | 41.0% | 53.0% |
| 2009 | 79.0% | 45.0% | 50.0% |
| 2008 | 65.0% | 57.0% | 47.0% |
| CST Summative High School Math Test | |||
| 2010 | 38.0% | 28.0% | 50.0% |
| 2009 | 37.0% | 28.0% | 47.0% |
| 2008 | 38.0% | 26.0% | 43.0% |
| CST U.S. History Test | |||
| 2010 | 35.0% | 28.0% | 45.0% |
| 2009 | 36.0% | 27.0% | 44.0% |
| 2008 | 30.0% | 26.0% | 38.0% |
| CST Biology Test | |||
| 2009 | 15.0% | 24.0% | 41.0% |
| 2008 | 6.0% | 33.0% | 39.0% |
| CST World History Test | |||
| 2009 | 3.0% | 25.0% | 11.0% |
| 2008 | 10.0% | 7.0% | 9.0% |
| CST Earth Science Test | |||
| 2008 | 5.0% | 6.0% | 28.0% |
End of Course - % of students at or above proficiency
| School | District | State | |
|---|---|---|---|
| CST Algebra I Test | |||
| 2010 | 2.0% | 11.0% | 31.0% |
| 2009 | 2.0% | 9.0% | 28.0% |
| 2008 | 3.0% | 10.0% | 25.0% |
| CST Algebra II Test | |||
| 2010 | 12.0% | 6.0% | 31.0% |
| 2009 | 11.0% | 8.0% | 28.0% |
| 2008 | 11.0% | 11.0% | 27.0% |
| CST Biology Test | |||
| 2010 | 27.0% | 24.0% | 46.0% |
| 2009 | 20.0% | 26.0% | 42.0% |
| 2008 | 22.0% | 27.0% | 42.0% |
| CST Chemistry Test | |||
| 2010 | 9.0% | 13.0% | 38.0% |
| 2009 | 8.0% | 13.0% | 36.0% |
| 2008 | 20.0% | 14.0% | 32.0% |
| CST Geometry Test | |||
| 2010 | 14.0% | 11.0% | 27.0% |
| 2009 | 9.0% | 8.0% | 26.0% |
| 2008 | 6.0% | 9.0% | 24.0% |
| CST Physics Test | |||
| 2010 | 55.0% | 40.0% | 49.0% |
| 2009 | 78.0% | 40.0% | 46.0% |
| 2008 | 68.0% | 46.0% | 43.0% |
| CST Summative High School Math Test | |||
| 2010 | 39.0% | 31.0% | 54.0% |
| 2009 | 42.0% | 33.0% | 50.0% |
| 2008 | 45.0% | 31.0% | 47.0% |
| CST World History Test | |||
| 2010 | 17.0% | 21.0% | 41.0% |
| 2009 | 23.0% | 22.0% | 38.0% |
| 2008 | 28.0% | 18.0% | 33.0% |
| CST Earth Science Test | |||
| 2008 | 7.0% | 7.0% | 28.0% |
Source: CA Department of Education 2009-2010
School Map and Similar Schools Nearby
Click to Activate Map of Nearby School Campuses
Private
Public
This School
Similar Schools Nearby
| Portola Junior High School 6-8 | 599 Students | 0.7 miles away | ![]() 5 out of 5 | |
| Albany High School 9-12 | 1,282 Students | 0.7 miles away | Not Yet Rated | |
| Kennedy High School 9-12 | 847 Students | 2.3 miles away | Not Yet Rated | |
| Berkeley High School 9-12 | 3,349 Students | 2.9 miles away | Not Yet Rated | |
| Richmond High School 9-12 | 1,671 Students | 4.2 miles away | ![]() 5 out of 5 | |
| De Anza High School 9-12 | 907 Students | 4.2 miles away | ![]() 5 out of 5 | |
| Emery Secondary School 7-12 | 337 Students | 5.0 miles away | Not Yet Rated | |
| Middle College High School 9-12 | 311 Students | 5.0 miles away | ![]() 4 out of 5 | |
| Crespi Junior High School 7-8 | 581 Students | 5.5 miles away | Not Yet Rated | |
| Oakland Technical High School 9-12 | 1,694 Students | 5.6 miles away | Not Yet Rated | |
Compare This School To Nearby Schools ->
School Community Forum

Join a discussion about El Cerrito High School and talk to others in the community including students, parents, teachers, and administrators.
Popular Discussion Topics
- Admissions and Registration Questions (e.g. Dress Code and Discipline Policy)
- School Calendar and Upcoming Events (e.g. Graduation)
- After School Programs, Extracurricular Activities, and Athletics (e.g. Football)
- News and Announcements (e.g. Yearbook and Class Supply List Details)
- Graduate and Alumni Events (e.g. Organizing Class Reunions)
Navigation
Can't Find What You Are Looking For?
Rankings
Nearby Cities
Sponsored Links
K-12 Articles
The Importance of Ninth Grade
Students who are entering ninth grade do not realize the importance of the critical decisions they...
Teachers Packing Heat
After the recent school shootings (and thwarted school shootings) in the past month-just as after...
Internet Safety for Kids of All Ages
Kids are being introduced to the Internet at a very young age. Research for homework and school...


