Emery Secondary School

No Reviews Yet
Find Old Friends From Emery Secondary School
Use the form below to search for alumni from Emery Secondary School.
School Description
School Summary and Highlights
- Enrolls 337 middle and high school students from grades 7-12
- Ranks 1086th out of 1,197 high schools in CA.
- 2010 Overall School AYP Met Status: No
Additional Contact Information
- Mailing Address: 1100 47th St., Emeryville, CA 94608
School Operational Details
- Title I EligibleAll students of this school are eligible for participation in authorized programs.
School District Details
- Emery Unified School District
- Per-Pupil Spending: $14,670
- Graduation Rate: 69.5%
- Dropout Rate: 3.2%
- Students Per Teacher: 17.5
- Enrolled Students: 757
Faculty Details and Student Enrollment
Students and Faculty
- Total Students Enrolled: 337
- Total Full Time "Equivalent" Teachers: 23.2
- Average Student-To-Teacher Ratio: 14.5
Students Gender Breakdown
- Males: 164 (48.7%)
- Females: 173 (51.3%)
Free Lunch Student Eligibility Breakdown
- Eligible for Reduced Lunch: 35 (10.4%)
- Eligible for Free Lunch: 218 (64.7%)
- Eligible for Either Reduced or Free Lunch: 253 (75.1%)
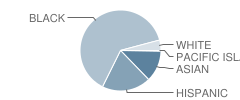
Student Enrollment Distribution by Race / Ethnicity

| Number | Percent | |
|---|---|---|
| American Indian | - | - |
| Black | 214 | 63.5% |
| Asian | 42 | 12.5% |
| Hispanic | 66 | 19.6% |
| White | 14 | 4.2% |
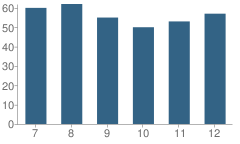
Number of Students Per Grade

| Number | Percent | |
|---|---|---|
| 7th Grade | 60 | 17.8% |
| 8th Grade | 62 | 18.4% |
| 9th Grade | 55 | 16.3% |
| 10th Grade | 50 | 14.8% |
| 11th Grade | 53 | 15.7% |
| 12th Grade | 57 | 16.9% |
Graduates Information (2010)
Graduation Rate
School:
74.3%
District:
74.3%
State:
78.6%
Teacher Education Background (2009)
Percent With Ph.D.: 9.4%
Percent With Master's Degree: 15.6%
Percent With Bachelor's Degree: 15.6%
Teacher Credentials & Experience (2009)
Percent of Teachers With Emergency Credentials: 10.7%
Percent of Teachers With Credentials: 100.0%
Number of Certificated Staff: 32.0
Average Number of Years of Teacher Experience: 8.5
Average Age: 39.6
Source: CA Department of Education, Source: NCES 2009-2010
School Ratings and Reviews
Be The First To Review Emery Secondary School!
Sponsored Links
Test Scores and Performance Information
Overall School Rating
How is this determined?
The overall school rating shows that Emery Secondary School performed on average worse than many other schools across the state on CST state exams in the following subjects:
- CST Algebra I
- CST Algebra II
- CST Biology
- CST Chemistry
- CST English-Language Arts
- CST General Mathematics
- CST Geometry
- CST History - Social Science
- CST Mathematics
- CST Physics
- CST Science
- CST Summative High School Math
- CST U.S. History
- CST World History
AYP Results (2010)
Overall AYP Met: No
ELA AYP Met: No
Math AYP Met: No
ACT Exam Results (2009)
Percent of Students Taking ACT Exam: 7.7%
SAT Exam Results (2009)
Percent of Students Taking SAT Exam: 35.4%
Average Combined Score: 1,243.9
Critical Reading Average: 414.8
Math Average: 416.1
Writing Average: 413.0
Percent Scoring At or Above 1500: 17.4%
CST - Test Proficiency by Grade and Subject
Grade 7 - % of students at or above proficiency
| School | District | State | |
|---|---|---|---|
| CST English-Language Arts Test | |||
| 2010 | 31.0% | 31.0% | 55.0% |
| 2009 | 46.0% | 46.0% | 54.0% |
| 2008 | 29.0% | 29.0% | 49.0% |
| CST Mathematics Test | |||
| 2010 | 33.0% | 33.0% | 48.0% |
| 2009 | 16.0% | 16.0% | 43.0% |
| 2008 | 11.0% | 11.0% | 41.0% |
Grade 8 - % of students at or above proficiency
| School | District | State | |
|---|---|---|---|
| CST Algebra I Test | |||
| 2010 | 33.0% | 33.0% | 46.0% |
| 2009 | - | - | - |
| 2008 | 20.0% | 20.0% | 42.0% |
| CST English-Language Arts Test | |||
| 2010 | 48.0% | 48.0% | 54.0% |
| 2009 | 23.0% | 23.0% | 48.0% |
| 2008 | 25.0% | 25.0% | 45.0% |
| CST General Mathematics Test | |||
| 2010 | 11.0% | 11.0% | 30.0% |
| 2009 | 13.0% | 13.0% | 30.0% |
| 2008 | 7.0% | 7.0% | 31.0% |
| CST History - Social Science Test | |||
| 2010 | 40.0% | 40.0% | 47.0% |
| 2009 | 16.0% | 16.0% | 42.0% |
| 2008 | 27.0% | 27.0% | 36.0% |
| CST Science Test | |||
| 2010 | 37.0% | 37.0% | 59.0% |
| 2009 | 33.0% | 33.0% | 56.0% |
| 2008 | 30.0% | 30.0% | 52.0% |
Grade 9 - % of students at or above proficiency
| School | District | State | |
|---|---|---|---|
| CST Algebra I Test | |||
| 2010 | 11.0% | 11.0% | 22.0% |
| 2009 | - | - | - |
| 2008 | 2.0% | 2.0% | 18.0% |
| CST English-Language Arts Test | |||
| 2010 | 23.0% | 23.0% | 54.0% |
| 2009 | 29.0% | 29.0% | 50.0% |
| 2008 | 32.0% | 32.0% | 49.0% |
| CST Geometry Test | |||
| 2010 | 8.0% | 8.0% | 46.0% |
| 2009 | 15.0% | 15.0% | 47.0% |
| CST Physics Test | |||
| 2008 | 6.0% | 6.0% | 30.0% |
| CST World History Test | |||
| 2008 | 40.0% | 40.0% | 36.0% |
Grade 10 - % of students at or above proficiency
| School | District | State | |
|---|---|---|---|
| CST Algebra II Test | |||
| 2010 | 9.0% | 9.0% | 40.0% |
| 2009 | - | - | - |
| 2008 | 38.0% | 38.0% | 36.0% |
| CST Biology Test | |||
| 2010 | 9.0% | 9.0% | 38.0% |
| 2009 | 14.0% | 14.0% | 34.0% |
| CST English-Language Arts Test | |||
| 2010 | 20.0% | 20.0% | 45.0% |
| 2009 | 31.0% | 31.0% | 44.0% |
| 2008 | 31.0% | 31.0% | 41.0% |
| CST Geometry Test | |||
| 2010 | 3.0% | 3.0% | 14.0% |
| 2009 | - | - | - |
| 2008 | 10.0% | 10.0% | 12.0% |
| CST Science Test | |||
| 2010 | 11.0% | 11.0% | 46.0% |
| 2009 | 23.0% | 23.0% | 44.0% |
| 2008 | 5.0% | 5.0% | 40.0% |
| CST World History Test | |||
| 2010 | 20.0% | 20.0% | 42.0% |
| 2009 | 16.0% | 16.0% | 38.0% |
| 2008 | 23.0% | 23.0% | 33.0% |
| CST Algebra I Test | |||
| 2008 | 5.0% | 5.0% | 9.0% |
| CST Chemistry Test | |||
| 2008 | 15.0% | 15.0% | 41.0% |
Grade 11 - % of students at or above proficiency
| School | District | State | |
|---|---|---|---|
| CST Algebra II Test | |||
| 2010 | 6.0% | 6.0% | 14.0% |
| 2009 | 12.0% | 12.0% | 12.0% |
| CST Chemistry Test | |||
| 2010 | 14.0% | 14.0% | 30.0% |
| CST English-Language Arts Test | |||
| 2010 | 25.0% | 25.0% | 42.0% |
| 2009 | 36.0% | 35.0% | 40.0% |
| 2008 | 15.0% | 15.0% | 37.0% |
| CST U.S. History Test | |||
| 2010 | 24.0% | 24.0% | 45.0% |
| 2009 | 44.0% | 43.0% | 44.0% |
| 2008 | 16.0% | 16.0% | 38.0% |
| CST Biology Test | |||
| 2009 | 22.0% | 22.0% | 41.0% |
| 2008 | 23.0% | 23.0% | 39.0% |
| CST Geometry Test | |||
| 2009 | 7.0% | 7.0% | 7.0% |
| CST Summative High School Math Test | |||
| 2009 | 62.0% | 62.0% | 47.0% |
End of Course - % of students at or above proficiency
| School | District | State | |
|---|---|---|---|
| CST Algebra I Test | |||
| 2010 | 18.0% | 18.0% | 31.0% |
| 2009 | 5.0% | 5.0% | 28.0% |
| 2008 | 7.0% | 7.0% | 25.0% |
| CST Algebra II Test | |||
| 2010 | 6.0% | 6.0% | 31.0% |
| 2009 | 12.0% | 12.0% | 28.0% |
| 2008 | 30.0% | 30.0% | 27.0% |
| CST Biology Test | |||
| 2010 | 9.0% | 9.0% | 46.0% |
| 2009 | 18.0% | 18.0% | 42.0% |
| 2008 | 24.0% | 24.0% | 42.0% |
| CST Chemistry Test | |||
| 2010 | 14.0% | 14.0% | 38.0% |
| 2009 | - | - | - |
| 2008 | 12.0% | 12.0% | 32.0% |
| CST General Mathematics Test | |||
| 2010 | 11.0% | 11.0% | 27.0% |
| 2009 | 13.0% | 13.0% | 26.0% |
| 2008 | 6.0% | 6.0% | 27.0% |
| CST Geometry Test | |||
| 2010 | 14.0% | 14.0% | 27.0% |
| 2009 | 5.0% | 5.0% | 26.0% |
| 2008 | 6.0% | 6.0% | 24.0% |
| CST World History Test | |||
| 2010 | 20.0% | 20.0% | 41.0% |
| 2009 | 16.0% | 16.0% | 38.0% |
| 2008 | 27.0% | 27.0% | 33.0% |
| CST Summative High School Math Test | |||
| 2009 | 69.0% | 69.0% | 50.0% |
| CST Physics Test | |||
| 2008 | 6.0% | 6.0% | 43.0% |
Source: CA Department of Education 2009-2010
School Map and Similar Schools Nearby
Click to Activate Map of Nearby School Campuses
Private
Public
This School
Similar Schools Nearby
| Expression, Excellence, Community, Empowerment & Learning School 9-12 | 247 Students | 1.2 miles away | Not Yet Rated | |
| Oakland Technical High School 9-12 | 1,694 Students | 1.4 miles away | Not Yet Rated | |
| Berkeley High School 9-12 | 3,349 Students | 2.4 miles away | Not Yet Rated | |
| Piedmont High School 9-12 | 785 Students | 2.8 miles away | Not Yet Rated | |
| Metwest High School 9-12 | 137 Students | 3.1 miles away | Not Yet Rated | |
| Oakland High School 9-12 | 1,817 Students | 3.2 miles away | Not Yet Rated | |
| Albany High School 9-12 | 1,282 Students | 4.3 miles away | Not Yet Rated | |
| Encinal High School 9-12 | 1,072 Students | 4.3 miles away | ![]() 5 out of 5 | |
| El Cerrito High School 9-12 | 1,243 Students | 5.0 miles away | Not Yet Rated | |
| Alameda High School 9-12 | 1,904 Students | 5.3 miles away | ![]() 5 out of 5 | |
Compare This School To Nearby Schools ->
School Community Forum

Join a discussion about Emery Secondary School and talk to others in the community including students, parents, teachers, and administrators.
Popular Discussion Topics
- Admissions and Registration Questions (e.g. Dress Code and Discipline Policy)
- School Calendar and Upcoming Events (e.g. Graduation)
- After School Programs, Extracurricular Activities, and Athletics (e.g. Football)
- News and Announcements (e.g. Yearbook and Class Supply List Details)
- Graduate and Alumni Events (e.g. Organizing Class Reunions)
Navigation
Can't Find What You Are Looking For?
Rankings
Nearby Cities
Sponsored Links
K-12 Articles
The Importance of Reading for Children Preschool to Grade Three
The first teachers of children are their parents. From the time they are infants, children need to...
Helping Young Children with Printing and Cursive Writing
Is your child experiencing difficulty printing or writing? Is he unable to print or write legibly,...
Who is Safe?
Between September 26 and October 2, 2006, there were three deadly school shootings and...

