International Studies Academy

No Reviews Yet
Find Old Friends From International Studies Academy
Use the form below to search for alumni from International Studies Academy.
School Description
School Summary and Highlights
- Enrolls 477 middle and high school students from grades 6-12
- Ranks 1047th out of 1,197 high schools in CA.
- 2010 Overall School AYP Met Status: No
Additional Contact Information
- Mailing Address: 655 De Haro St., San Francisco, CA 94107
School Operational Details
- Alternative School
School District Details
- San Francisco Unified School District
- Per-Pupil Spending: $9,711
- Graduation Rate: 77.7%
- Dropout Rate: 4.6%
- Students Per Teacher: 17.7
- Enrolled Students: 55,140
Faculty Details and Student Enrollment
Students and Faculty
- Total Students Enrolled: 477
- Total Full Time "Equivalent" Teachers: 38.8
- Average Student-To-Teacher Ratio: 12.3
Students Gender Breakdown
- Males: 241 (50.5%)
- Females: 236 (49.5%)
Free Lunch Student Eligibility Breakdown
- Eligible for Reduced Lunch: 38 (8.0%)
- Eligible for Free Lunch: 231 (48.4%)
- Eligible for Either Reduced or Free Lunch: 269 (56.4%)
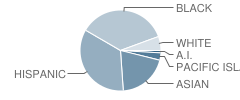
Student Enrollment Distribution by Race / Ethnicity

| Number | Percent | |
|---|---|---|
| American Indian | 6 | 1.3% |
| Black | 164 | 34.4% |
| Asian | 92 | 19.3% |
| Hispanic | 157 | 32.9% |
| White | 27 | 5.7% |
Number of Students Per Grade

| Number | Percent | |
|---|---|---|
| 6th Grade | 47 | 9.9% |
| 7th Grade | 37 | 7.8% |
| 8th Grade | 45 | 9.4% |
| 9th Grade | 121 | 25.4% |
| 10th Grade | 83 | 17.4% |
| 11th Grade | 66 | 13.8% |
| 12th Grade | 78 | 16.4% |
Graduates Information (2010)
Graduation Rate
School:
70.2%
District:
85.7%
State:
78.6%
Teacher Education Background (2009)
Percent With Ph.D.
School:
2.4%
District:
2.4%
Percent With Master's Degree
School:
24.4%
District:
41.2%
Percent With Bachelor's Degree
School:
14.6%
District:
9.2%
Teacher Credentials & Experience (2009)
Percent of Teachers With Emergency Credentials: 6.1%
Percent of Teachers With Credentials: 93.9%
Number of Certificated Staff: 41.0
Average Number of Years of Teacher Experience: 7.4
Average Age
School:
35.3
District:
43.3
Source: CA Department of Education, Source: NCES 2009-2010
School Ratings and Reviews
Be The First To Review International Studies Academy!
Sponsored Links
Test Scores and Performance Information
Overall School Rating
How is this determined?
The overall school rating shows that International Studies Academy performed on average much worse than most other schools across the state on CST state exams in the following subjects:
- CST Algebra I
- CST Algebra II
- CST Biology
- CST Chemistry
- CST Earth Science
- CST English-Language Arts
- CST General Mathematics
- CST Geometry
- CST History - Social Science
- CST Integrated Math 1
- CST Mathematics
- CST Physics
- CST Science
- CST Summative High School Math
- CST U.S. History
- CST World History
AYP Results (2010)
Overall AYP Met: No
ELA AYP Met: No
Math AYP Met: No
ACT Exam Results (2009)
Percent of Students Taking ACT Exam: 14.7%
SAT Exam Results (2009)
Percent of Students Taking SAT Exam: 45.6%
Average Combined Score: 1,253.6
Critical Reading Average: 403.6
Math Average: 451.6
Writing Average: 398.4
Percent Scoring At or Above 1500: 19.4%
CST - Test Proficiency by Grade and Subject
Grade 6 - % of students at or above proficiency
| School | District | State | |
|---|---|---|---|
| CST English-Language Arts Test | |||
| 2010 | 36.0% | 58.0% | 55.0% |
| 2009 | 20.0% | 55.0% | 52.0% |
| CST Mathematics Test | |||
| 2010 | 23.0% | 59.0% | 52.0% |
| 2009 | 12.0% | 54.0% | 49.0% |
Grade 7 - % of students at or above proficiency
| School | District | State | |
|---|---|---|---|
| CST English-Language Arts Test | |||
| 2010 | 21.0% | 60.0% | 55.0% |
| 2009 | 21.0% | 58.0% | 54.0% |
| CST Mathematics Test | |||
| 2010 | 15.0% | 61.0% | 48.0% |
| 2009 | 22.0% | 60.0% | 43.0% |
Grade 8 - % of students at or above proficiency
| School | District | State | |
|---|---|---|---|
| CST English-Language Arts Test | |||
| 2010 | 13.0% | 58.0% | 54.0% |
| 2009 | 21.0% | 53.0% | 48.0% |
| CST History - Social Science Test | |||
| 2010 | 13.0% | 51.0% | 47.0% |
| 2009 | 23.0% | 46.0% | 42.0% |
| CST Science Test | |||
| 2010 | 11.0% | 63.0% | 59.0% |
| 2009 | 32.0% | 57.0% | 56.0% |
| CST General Mathematics Test | |||
| 2009 | 31.0% | 37.0% | 30.0% |
Grade 9 - % of students at or above proficiency
| School | District | State | |
|---|---|---|---|
| CST Algebra I Test | |||
| 2010 | 8.0% | 27.0% | 22.0% |
| 2009 | 11.0% | 29.0% | 21.0% |
| 2008 | 12.0% | 30.0% | 18.0% |
| CST Biology Test | |||
| 2010 | 16.0% | 54.0% | 55.0% |
| 2009 | 15.0% | 62.0% | 51.0% |
| CST English-Language Arts Test | |||
| 2010 | 33.0% | 58.0% | 54.0% |
| 2009 | 35.0% | 54.0% | 50.0% |
| 2008 | 26.0% | 54.0% | 49.0% |
| CST Earth Science Test | |||
| 2008 | 11.0% | 27.0% | 31.0% |
Grade 10 - % of students at or above proficiency
| School | District | State | |
|---|---|---|---|
| CST Algebra II Test | |||
| 2010 | 14.0% | 58.0% | 40.0% |
| 2009 | 16.0% | 62.0% | 37.0% |
| CST Biology Test | |||
| 2010 | 16.0% | 37.0% | 38.0% |
| 2009 | 9.0% | 31.0% | 34.0% |
| 2008 | 20.0% | 33.0% | 35.0% |
| CST Chemistry Test | |||
| 2010 | 39.0% | 63.0% | 47.0% |
| CST English-Language Arts Test | |||
| 2010 | 22.0% | 51.0% | 45.0% |
| 2009 | 18.0% | 50.0% | 44.0% |
| 2008 | 14.0% | 48.0% | 41.0% |
| CST Geometry Test | |||
| 2010 | 4.0% | 32.0% | 14.0% |
| 2009 | 8.0% | 36.0% | 14.0% |
| 2008 | 4.0% | 33.0% | 12.0% |
| CST Integrated Math 1 Test | |||
| 2010 | 6.0% | 8.0% | 11.0% |
| 2009 | 6.0% | 12.0% | 9.0% |
| CST Physics Test | |||
| 2010 | 6.0% | 56.0% | 44.0% |
| CST Science Test | |||
| 2010 | 27.0% | 54.0% | 46.0% |
| 2009 | 25.0% | 52.0% | 44.0% |
| 2008 | 21.0% | 47.0% | 40.0% |
| CST World History Test | |||
| 2010 | 19.0% | 42.0% | 42.0% |
| 2009 | 12.0% | 37.0% | 38.0% |
| 2008 | 13.0% | 31.0% | 33.0% |
Grade 11 - % of students at or above proficiency
| School | District | State | |
|---|---|---|---|
| CST Algebra II Test | |||
| 2010 | 19.0% | 24.0% | 14.0% |
| 2009 | 16.0% | 22.0% | 12.0% |
| 2008 | 11.0% | 24.0% | 11.0% |
| CST Biology Test | |||
| 2010 | 9.0% | 56.0% | 46.0% |
| 2009 | 60.0% | 50.0% | 41.0% |
| CST Chemistry Test | |||
| 2010 | 15.0% | 34.0% | 30.0% |
| 2009 | 37.0% | 35.0% | 27.0% |
| 2008 | 24.0% | 28.0% | 25.0% |
| CST English-Language Arts Test | |||
| 2010 | 29.0% | 51.0% | 42.0% |
| 2009 | 20.0% | 48.0% | 40.0% |
| 2008 | 19.0% | 44.0% | 37.0% |
| CST Geometry Test | |||
| 2010 | 9.0% | 9.0% | 6.0% |
| 2009 | - | - | - |
| 2008 | 6.0% | 12.0% | 6.0% |
| CST Physics Test | |||
| 2010 | 29.0% | 46.0% | 53.0% |
| 2009 | 16.0% | 40.0% | 50.0% |
| CST U.S. History Test | |||
| 2010 | 25.0% | 51.0% | 45.0% |
| 2009 | 27.0% | 50.0% | 44.0% |
| 2008 | 27.0% | 42.0% | 38.0% |
| CST Integrated Math 1 Test | |||
| 2009 | 5.0% | 15.0% | 9.0% |
| CST Summative High School Math Test | |||
| 2009 | 59.0% | 63.0% | 47.0% |
End of Course - % of students at or above proficiency
| School | District | State | |
|---|---|---|---|
| CST Algebra I Test | |||
| 2010 | 4.0% | 40.0% | 31.0% |
| 2009 | 10.0% | 38.0% | 28.0% |
| 2008 | 9.0% | 37.0% | 25.0% |
| CST Algebra II Test | |||
| 2010 | 18.0% | 43.0% | 31.0% |
| 2009 | 16.0% | 43.0% | 28.0% |
| 2008 | 11.0% | 44.0% | 27.0% |
| CST Biology Test | |||
| 2010 | 15.0% | 47.0% | 46.0% |
| 2009 | 17.0% | 46.0% | 42.0% |
| 2008 | 20.0% | 48.0% | 42.0% |
| CST Chemistry Test | |||
| 2010 | 29.0% | 46.0% | 38.0% |
| 2009 | 38.0% | 48.0% | 36.0% |
| 2008 | 24.0% | 42.0% | 32.0% |
| CST Geometry Test | |||
| 2010 | 8.0% | 39.0% | 27.0% |
| 2009 | 4.0% | 39.0% | 26.0% |
| 2008 | 4.0% | 37.0% | 24.0% |
| CST Integrated Math 1 Test | |||
| 2010 | 4.0% | 10.0% | 13.0% |
| 2009 | 5.0% | 14.0% | 11.0% |
| CST Physics Test | |||
| 2010 | 20.0% | 46.0% | 49.0% |
| 2009 | 15.0% | 45.0% | 46.0% |
| CST World History Test | |||
| 2010 | 18.0% | 46.0% | 41.0% |
| 2009 | 11.0% | 41.0% | 38.0% |
| 2008 | 12.0% | 37.0% | 33.0% |
| CST Earth Science Test | |||
| 2009 | 9.0% | 24.0% | 28.0% |
| 2008 | 12.0% | 26.0% | 28.0% |
| CST General Mathematics Test | |||
| 2009 | 28.0% | 32.0% | 26.0% |
| CST Summative High School Math Test | |||
| 2009 | 59.0% | 64.0% | 50.0% |
| 2008 | 18.0% | 60.0% | 47.0% |
Source: CA Department of Education 2009-2010
School Map and Similar Schools Nearby
Click to Activate Map of Nearby School Campuses
Private
Public
This School
Similar Schools Nearby
| Downtown High (Continuation) School 9-12 | 239 Students | 0.2 miles away | Not Yet Rated | |
| San Francisco County Alternative / Opportunity School 6-12 | 73 Students | 0.9 miles away | Not Yet Rated | |
| Sf International High School 9-12 | 60 Students | 1.4 miles away | Not Yet Rated | - |
| San Francisco County Community School 6-12 | 207 Students | 1.8 miles away | Not Yet Rated | |
| Wells (Ida B.) High (Continuation / Alternative) School 9-12 | 233 Students | 2.1 miles away | Not Yet Rated | |
| Academy of Arts and Sciences 9-12 | 337 Students | 2.9 miles away | Not Yet Rated | - |
| San Francisco County Court Woodside Learning Center School 6-12 | 150 Students | 3.0 miles away | Not Yet Rated | |
| June Jordan School for Equity 9-12 | 265 Students | 3.2 miles away | Not Yet Rated | |
| Independence High (Alternative) School 9-12 | 368 Students | 5.5 miles away | Not Yet Rated | |
| Thornton High School 9-12 | 226 Students | 5.9 miles away | Not Yet Rated | |
Compare This School To Nearby Schools ->
School Community Forum

Join a discussion about International Studies Academy and talk to others in the community including students, parents, teachers, and administrators.
Popular Discussion Topics
- Admissions and Registration Questions (e.g. Dress Code and Discipline Policy)
- School Calendar and Upcoming Events (e.g. Graduation)
- After School Programs, Extracurricular Activities, and Athletics (e.g. Football)
- News and Announcements (e.g. Yearbook and Class Supply List Details)
- Graduate and Alumni Events (e.g. Organizing Class Reunions)
Navigation
Can't Find What You Are Looking For?
Rankings
Sponsored Links
K-12 Articles
Is Your Child's Teacher a Bully?
We've all heard about kids being bullied by peers. Kids taunt, tease, pull hair, shove and push...
Beating the Summer Slump
"The Summer Slump", teachers call it. It happens every year. It makes its way into lesson plans...
Parent-Teacher Conference Dos and Don'ts
Finals are over and done, and grades have arrived. Now comes the dreaded time to discuss the...
