San Marino High School

No Reviews Yet
Find Old Friends From San Marino High School
Use the form below to search for alumni from San Marino High School.
School Description
School Summary and Highlights
- Enrolls 1,146 high school students from grades 9-12
- Ranks 6th out of 1,197 high schools in CA.
- 2010 Overall School AYP Met Status: Yes
- National Blue Ribbon Schools Award 2006

Additional Contact Information
- Mailing Address: 2701 Huntington Dr., San Marino, CA 91108
School District Details
- San Marino Unified School District
- Per-Pupil Spending: $9,789
- Graduation Rate: 98.3%
- Dropout Rate: 0.8%
- Students Per Teacher: 23.0
- Enrolled Students: 3,228
Faculty Details and Student Enrollment
Students and Faculty
- Total Students Enrolled: 1,146
- Total Full Time "Equivalent" Teachers: 50.2
- Average Student-To-Teacher Ratio: 22.8
Students Gender Breakdown
- Males: 578 (50.4%)
- Females: 568 (49.6%)
Free Lunch Student Eligibility Breakdown
- Eligible for Reduced Lunch: 8 (0.7%)
- Eligible for Free Lunch: 5 (0.4%)
- Eligible for Either Reduced or Free Lunch: 13 (1.1%)
Student Enrollment Distribution by Race / Ethnicity
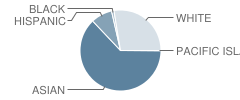
| Number | Percent | |
|---|---|---|
| American Indian | - | - |
| Black | 11 | 1.0% |
| Asian | 710 | 62.0% |
| Hispanic | 96 | 8.4% |
| White | 312 | 27.2% |
Number of Students Per Grade
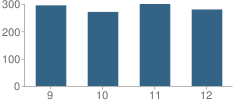
| Number | Percent | |
|---|---|---|
| 9th Grade | 295 | 25.7% |
| 10th Grade | 271 | 23.6% |
| 11th Grade | 300 | 26.2% |
| 12th Grade | 280 | 24.4% |
Graduates Information (2010)
Graduation Rate
School:
99.3%
District:
99.3%
State:
78.6%
Teacher Education Background (2009)
Percent With Ph.D.
School:
4.8%
District:
25.0%
Percent With Master's Degree
School:
1.6%
District:
50.0%
Percent With Bachelor's Degree: 7.9%
Teacher Credentials & Experience (2009)
Percent of Teachers With Credentials: 100.0%
Number of Certificated Staff: 63.0
Average Number of Years of Teacher Experience: 19.1
Average Age
School:
46.3
District:
47.3
Source: CA Department of Education, Source: NCES 2009-2010
School Ratings and Reviews
Be The First To Review San Marino High School!
Sponsored Links
Test Scores and Performance Information
Overall School Rating
How is this determined?
The overall school rating shows that San Marino High School performed on average much better than most other schools across the state on CST state exams in the following subjects:
- CST Algebra I
- CST Algebra II
- CST Biology
- CST Chemistry
- CST Earth Science
- CST English-Language Arts
- CST General Mathematics
- CST Geometry
- CST Physics
- CST Science
- CST Summative High School Math
- CST U.S. History
- CST World History
AYP Results (2010)
Overall AYP Met: Yes
ELA AYP Met: Yes
Math AYP Met: Yes
ACT Exam Results (2009)
Percent of Students Taking ACT Exam: 34.4%
Average Combined Score: 27.0
Percent Scoring At or Above 21: 92.6%
SAT Exam Results (2009)
Percent of Students Taking SAT Exam: 94.9%
Average Combined Score: 1,807.8
Critical Reading Average: 585.7
Math Average: 631.9
Writing Average: 590.2
Percent Scoring At or Above 1500: 84.0%
CST - Test Proficiency by Grade and Subject
Grade 9 - % of students at or above proficiency
| School | District | State | |
|---|---|---|---|
| CST Algebra I Test | |||
| 2010 | 88.0% | 88.0% | 22.0% |
| 2009 | 71.0% | 71.0% | 21.0% |
| 2008 | 66.0% | 66.0% | 18.0% |
| CST Biology Test | |||
| 2010 | 97.0% | 97.0% | 55.0% |
| 2009 | 97.0% | 97.0% | 51.0% |
| 2008 | 97.0% | 97.0% | 52.0% |
| CST English-Language Arts Test | |||
| 2010 | 96.0% | 96.0% | 54.0% |
| 2009 | 97.0% | 97.0% | 50.0% |
| 2008 | 92.0% | 92.0% | 49.0% |
| CST General Mathematics Test | |||
| 2010 | 71.0% | 71.0% | 17.0% |
| 2009 | 77.0% | 77.0% | 17.0% |
| 2008 | 55.0% | 51.0% | 18.0% |
| CST Geometry Test | |||
| 2010 | 94.0% | 94.0% | 46.0% |
| 2009 | 96.0% | 96.0% | 47.0% |
| 2008 | 90.0% | 90.0% | 43.0% |
| CST World History Test | |||
| 2010 | 67.0% | 67.0% | 45.0% |
| 2009 | 72.0% | 72.0% | 41.0% |
| 2008 | 55.0% | 55.0% | 36.0% |
Grade 10 - % of students at or above proficiency
| School | District | State | |
|---|---|---|---|
| CST Algebra I Test | |||
| 2010 | 50.0% | 50.0% | 12.0% |
| 2009 | 58.0% | 58.0% | 11.0% |
| 2008 | 63.0% | 63.0% | 9.0% |
| CST Algebra II Test | |||
| 2010 | 86.0% | 86.0% | 40.0% |
| 2009 | 77.0% | 77.0% | 37.0% |
| 2008 | 79.0% | 79.0% | 36.0% |
| CST Biology Test | |||
| 2010 | 80.0% | 80.0% | 38.0% |
| 2009 | 81.0% | 81.0% | 34.0% |
| 2008 | 91.0% | 91.0% | 35.0% |
| CST Chemistry Test | |||
| 2010 | 92.0% | 92.0% | 47.0% |
| 2009 | 85.0% | 85.0% | 44.0% |
| 2008 | 92.0% | 92.0% | 41.0% |
| CST English-Language Arts Test | |||
| 2010 | 90.0% | 90.0% | 45.0% |
| 2009 | 90.0% | 90.0% | 44.0% |
| 2008 | 86.0% | 86.0% | 41.0% |
| CST Geometry Test | |||
| 2010 | 57.0% | 57.0% | 14.0% |
| 2009 | 43.0% | 43.0% | 14.0% |
| 2008 | 58.0% | 58.0% | 12.0% |
| CST Science Test | |||
| 2010 | 85.0% | 85.0% | 46.0% |
| 2009 | 83.0% | 83.0% | 44.0% |
| 2008 | 84.0% | 84.0% | 40.0% |
| CST World History Test | |||
| 2010 | 90.0% | 90.0% | 42.0% |
| 2009 | 83.0% | 83.0% | 38.0% |
| 2008 | 80.0% | 80.0% | 33.0% |
Grade 11 - % of students at or above proficiency
| School | District | State | |
|---|---|---|---|
| CST Algebra II Test | |||
| 2010 | 25.0% | 25.0% | 14.0% |
| 2009 | 22.0% | 22.0% | 12.0% |
| 2008 | 22.0% | 22.0% | 11.0% |
| CST Biology Test | |||
| 2010 | 86.0% | 86.0% | 46.0% |
| 2009 | 55.0% | 55.0% | 41.0% |
| 2008 | 61.0% | 61.0% | 39.0% |
| CST Chemistry Test | |||
| 2010 | 87.0% | 87.0% | 30.0% |
| 2009 | 78.0% | 78.0% | 27.0% |
| 2008 | 79.0% | 79.0% | 25.0% |
| CST Earth Science Test | |||
| 2010 | 38.0% | 38.0% | 32.0% |
| CST English-Language Arts Test | |||
| 2010 | 85.0% | 85.0% | 42.0% |
| 2009 | 89.0% | 89.0% | 40.0% |
| 2008 | 88.0% | 88.0% | 37.0% |
| CST Physics Test | |||
| 2010 | 79.0% | 79.0% | 53.0% |
| 2009 | 92.0% | 92.0% | 50.0% |
| 2008 | 71.0% | 71.0% | 47.0% |
| CST Summative High School Math Test | |||
| 2010 | 81.0% | 81.0% | 50.0% |
| 2009 | 89.0% | 89.0% | 47.0% |
| 2008 | 77.0% | 77.0% | 43.0% |
| CST U.S. History Test | |||
| 2010 | 83.0% | 83.0% | 45.0% |
| 2009 | 86.0% | 86.0% | 44.0% |
| 2008 | 79.0% | 79.0% | 38.0% |
| CST Geometry Test | |||
| 2009 | 29.0% | 29.0% | 7.0% |
| 2008 | 12.0% | 12.0% | 6.0% |
| CST World History Test | |||
| 2008 | 68.0% | 68.0% | 9.0% |
End of Course - % of students at or above proficiency
| School | District | State | |
|---|---|---|---|
| CST Algebra I Test | |||
| 2010 | 80.0% | 93.0% | 31.0% |
| 2009 | 63.0% | 88.0% | 28.0% |
| 2008 | 60.0% | 85.0% | 25.0% |
| CST Algebra II Test | |||
| 2010 | 73.0% | 73.0% | 31.0% |
| 2009 | 66.0% | 66.0% | 28.0% |
| 2008 | 68.0% | 68.0% | 27.0% |
| CST Biology Test | |||
| 2010 | 91.0% | 91.0% | 46.0% |
| 2009 | 89.0% | 89.0% | 42.0% |
| 2008 | 94.0% | 94.0% | 42.0% |
| CST Chemistry Test | |||
| 2010 | 90.0% | 90.0% | 38.0% |
| 2009 | 82.0% | 82.0% | 36.0% |
| 2008 | 86.0% | 86.0% | 32.0% |
| CST Earth Science Test | |||
| 2010 | 38.0% | 38.0% | 33.0% |
| 2009 | 36.0% | 36.0% | 28.0% |
| 2008 | 12.0% | 11.0% | 28.0% |
| CST General Mathematics Test | |||
| 2010 | 71.0% | 75.0% | 27.0% |
| 2009 | 77.0% | 86.0% | 26.0% |
| 2008 | 55.0% | 77.0% | 27.0% |
| CST Geometry Test | |||
| 2010 | 85.0% | 85.0% | 27.0% |
| 2009 | 81.0% | 81.0% | 26.0% |
| 2008 | 79.0% | 79.0% | 24.0% |
| CST Physics Test | |||
| 2010 | 79.0% | 79.0% | 49.0% |
| 2009 | 92.0% | 92.0% | 46.0% |
| 2008 | 71.0% | 71.0% | 43.0% |
| CST Summative High School Math Test | |||
| 2010 | 82.0% | 82.0% | 54.0% |
| 2009 | 89.0% | 89.0% | 50.0% |
| 2008 | 77.0% | 77.0% | 47.0% |
| CST World History Test | |||
| 2010 | 82.0% | 81.0% | 41.0% |
| 2009 | 81.0% | 81.0% | 38.0% |
| 2008 | 71.0% | 71.0% | 33.0% |
Source: CA Department of Education 2009-2010
School Map and Similar Schools Nearby
Click to Activate Map of Nearby School Campuses
Private
Public
This School
Similar Schools Nearby
| Temple City High School 9-12 | 1,982 Students | 2.0 miles away | Not Yet Rated | |
| San Gabriel High School 9-12 | 2,429 Students | 2.4 miles away | Not Yet Rated | |
| Pasadena High School 9-12 | 2,188 Students | 2.6 miles away | ![]() 5 out of 5 | |
| Marshall Fundamental School 6-12 | 1,804 Students | 2.7 miles away | ![]() 4 out of 5 | |
| Blair High School 7-12 | 1,035 Students | 2.7 miles away | ![]() 5 out of 5 | |
| Alhambra High School 9-12 | 3,115 Students | 2.8 miles away | ![]() 3.5 out of 5 | |
| Gabrielino High School 9-12 | 1,768 Students | 2.9 miles away | Not Yet Rated | |
| Rosemead High School 9-12 | 2,050 Students | 3.2 miles away | ![]() 4 out of 5 | |
| South Pasadena High School 9-12 | 1,518 Students | 3.3 miles away | Not Yet Rated | |
| Arcadia High School 9-12 | 3,610 Students | 3.4 miles away | Not Yet Rated | |
Compare This School To Nearby Schools ->
School Community Forum

Join a discussion about San Marino High School and talk to others in the community including students, parents, teachers, and administrators.
Popular Discussion Topics
- Admissions and Registration Questions (e.g. Dress Code and Discipline Policy)
- School Calendar and Upcoming Events (e.g. Graduation)
- After School Programs, Extracurricular Activities, and Athletics (e.g. Football)
- News and Announcements (e.g. Yearbook and Class Supply List Details)
- Graduate and Alumni Events (e.g. Organizing Class Reunions)
Navigation
Can't Find What You Are Looking For?
Rankings
Nearby Cities
Sponsored Links
K-12 Articles
Internet Safety for Kids of All Ages
Kids are being introduced to the Internet at a very young age. Research for homework and school...
The Adolescent Monster
"What happened to my sweet little baby?" Every parent has or will ask that sometime during the...
Transform Your Middle School Slacker into a Scholar
All children need motivation to learn. Have your child's grades decreased since he started middle...


