Sir Francis Drake High School
1327 Sir Francis Drake Blvd, San Anselmo, CA 94960 | (415) 453-8770
- Grades: 9-12
- Student Enrollment: 1,049

No Reviews Yet
Find Old Friends From Sir Francis Drake High School
Use the form below to search for alumni from Sir Francis Drake High School.
School Description
School Summary and Highlights
- Enrolls 1,049 high school students from grades 9-12
- Ranks 159th out of 1,197 high schools in CA.
- 2010 Overall School AYP Met Status: Yes
Additional Contact Information
- Mailing Address: 1327 Sir Francis Drake Blvd., San Anselmo, CA 94960
School District Details
- Tamalpais Union High School District
- Per-Pupil Spending: $13,834
- Dropout Rate: 0.7%
- Students Per Teacher: 17.3
- Enrolled Students: 3,797
Faculty Details and Student Enrollment
Students and Faculty
- Total Students Enrolled: 1,049
- Total Full Time "Equivalent" Teachers: 60.0
- Average Student-To-Teacher Ratio: 17.5
Students Gender Breakdown
- Males: 537 (51.2%)
- Females: 512 (48.8%)
Free Lunch Student Eligibility Breakdown
- Eligible for Reduced Lunch: 24 (2.3%)
- Eligible for Free Lunch: 40 (3.8%)
- Eligible for Either Reduced or Free Lunch: 64 (6.1%)
Student Enrollment Distribution by Race / Ethnicity
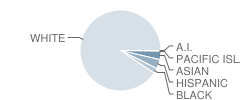
| Number | Percent | |
|---|---|---|
| American Indian | 2 | 0.2% |
| Black | 21 | 2.0% |
| Asian | 33 | 3.1% |
| Hispanic | 36 | 3.4% |
| White | 873 | 83.2% |
Number of Students Per Grade
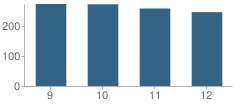
| Number | Percent | |
|---|---|---|
| 9th Grade | 273 | 26.0% |
| 10th Grade | 272 | 25.9% |
| 11th Grade | 258 | 24.6% |
| 12th Grade | 246 | 23.5% |
Graduates Information (2010)
Graduation Rate
School:
95.8%
District:
97.1%
State:
78.6%
Teacher Education Background (2009)
Percent With Ph.D.
School:
1.4%
District:
12.5%
Percent With Master's Degree
School:
36.5%
District:
12.5%
Percent With Bachelor's Degree: 4.1%
Teacher Credentials & Experience (2009)
Percent of Teachers With Credentials: 98.5%
Number of Certificated Staff: 74.0
Average Number of Years of Teacher Experience: 15.5
Average Age
School:
44.4
District:
43.5
Source: CA Department of Education, Source: NCES 2009-2010
School Ratings and Reviews
Be The First To Review Sir Francis Drake High School!
Sponsored Links
Test Scores and Performance Information
Overall School Rating
How is this determined?
The overall school rating shows that Sir Francis Drake High School performed on average better than many other schools across the state on CST state exams in the following subjects:
- CST Algebra I
- CST Algebra II
- CST Biology
- CST Chemistry
- CST Earth Science
- CST English-Language Arts
- CST General Mathematics
- CST Geometry
- CST Physics
- CST Science
- CST Summative High School Math
- CST U.S. History
- CST World History
AYP Results (2010)
Overall AYP Met: Yes
ELA AYP Met: Yes
Math AYP Met: Yes
ACT Exam Results (2009)
Percent of Students Taking ACT Exam: 27.5%
Average Combined Score: 24.3
Percent Scoring At or Above 21: 78.5%
SAT Exam Results (2009)
Percent of Students Taking SAT Exam: 72.0%
Average Combined Score: 1,689.9
Critical Reading Average: 566.4
Math Average: 560.8
Writing Average: 562.7
Percent Scoring At or Above 1500: 73.5%
CST - Test Proficiency by Grade and Subject
Grade 9 - % of students at or above proficiency
| School | District | State | |
|---|---|---|---|
| CST Algebra I Test | |||
| 2010 | 34.0% | 46.0% | 22.0% |
| 2009 | 48.0% | 53.0% | 21.0% |
| 2008 | 35.0% | 42.0% | 18.0% |
| CST Biology Test | |||
| 2010 | 57.0% | 49.0% | 55.0% |
| 2009 | 51.0% | 49.0% | 51.0% |
| 2008 | 59.0% | 57.0% | 52.0% |
| CST Earth Science Test | |||
| 2010 | 73.0% | 74.0% | 35.0% |
| 2009 | 52.0% | 65.0% | 29.0% |
| 2008 | 63.0% | 71.0% | 31.0% |
| CST English-Language Arts Test | |||
| 2010 | 83.0% | 82.0% | 54.0% |
| 2009 | 78.0% | 83.0% | 50.0% |
| 2008 | 81.0% | 82.0% | 49.0% |
| CST General Mathematics Test | |||
| 2010 | 28.0% | 27.0% | 17.0% |
| 2009 | 26.0% | 31.0% | 17.0% |
| 2008 | 23.0% | 21.0% | 18.0% |
| CST Geometry Test | |||
| 2010 | 74.0% | 80.0% | 46.0% |
| 2009 | 76.0% | 80.0% | 47.0% |
| 2008 | 77.0% | 77.0% | 43.0% |
| CST World History Test | |||
| 2009 | 68.0% | 68.0% | 41.0% |
Grade 10 - % of students at or above proficiency
| School | District | State | |
|---|---|---|---|
| CST Algebra I Test | |||
| 2010 | 11.0% | 19.0% | 12.0% |
| 2009 | 6.0% | 25.0% | 11.0% |
| 2008 | 16.0% | 24.0% | 9.0% |
| CST Algebra II Test | |||
| 2010 | 47.0% | 49.0% | 40.0% |
| 2009 | 40.0% | 44.0% | 37.0% |
| 2008 | 43.0% | 45.0% | 36.0% |
| CST Biology Test | |||
| 2010 | 67.0% | 77.0% | 38.0% |
| 2009 | 66.0% | 75.0% | 34.0% |
| 2008 | 70.0% | 79.0% | 35.0% |
| CST Earth Science Test | |||
| 2010 | 74.0% | 63.0% | 29.0% |
| 2009 | 73.0% | 50.0% | 23.0% |
| 2008 | 78.0% | 62.0% | 23.0% |
| CST English-Language Arts Test | |||
| 2010 | 75.0% | 77.0% | 45.0% |
| 2009 | 75.0% | 77.0% | 44.0% |
| 2008 | 74.0% | 73.0% | 41.0% |
| CST Geometry Test | |||
| 2010 | 34.0% | 27.0% | 14.0% |
| 2009 | 32.0% | 29.0% | 14.0% |
| 2008 | 33.0% | 25.0% | 12.0% |
| CST Science Test | |||
| 2010 | 73.0% | 78.0% | 46.0% |
| 2009 | 79.0% | 80.0% | 44.0% |
| 2008 | 72.0% | 75.0% | 40.0% |
| CST World History Test | |||
| 2010 | 65.0% | 72.0% | 42.0% |
| 2009 | 74.0% | 74.0% | 38.0% |
| 2008 | 67.0% | 70.0% | 33.0% |
Grade 11 - % of students at or above proficiency
| School | District | State | |
|---|---|---|---|
| CST Algebra II Test | |||
| 2010 | 11.0% | 13.0% | 14.0% |
| 2009 | 6.0% | 8.0% | 12.0% |
| 2008 | 7.0% | 8.0% | 11.0% |
| CST Biology Test | |||
| 2010 | 59.0% | 65.0% | 46.0% |
| 2009 | 67.0% | 70.0% | 41.0% |
| 2008 | 47.0% | 62.0% | 39.0% |
| CST Chemistry Test | |||
| 2010 | 62.0% | 77.0% | 30.0% |
| 2009 | 64.0% | 78.0% | 27.0% |
| 2008 | 49.0% | 71.0% | 25.0% |
| CST English-Language Arts Test | |||
| 2010 | 76.0% | 72.0% | 42.0% |
| 2009 | 75.0% | 76.0% | 40.0% |
| 2008 | 65.0% | 71.0% | 37.0% |
| CST Geometry Test | |||
| 2010 | 4.0% | 5.0% | 6.0% |
| 2009 | 18.0% | 15.0% | 7.0% |
| 2008 | 6.0% | 9.0% | 6.0% |
| CST Physics Test | |||
| 2010 | 30.0% | 44.0% | 53.0% |
| 2009 | - | - | - |
| 2008 | 31.0% | 50.0% | 47.0% |
| CST Summative High School Math Test | |||
| 2010 | 61.0% | 63.0% | 50.0% |
| 2009 | 56.0% | 57.0% | 47.0% |
| 2008 | 55.0% | 62.0% | 43.0% |
| CST U.S. History Test | |||
| 2010 | 69.0% | 74.0% | 45.0% |
| 2009 | 73.0% | 77.0% | 44.0% |
| 2008 | 64.0% | 70.0% | 38.0% |
End of Course - % of students at or above proficiency
| School | District | State | |
|---|---|---|---|
| CST Algebra I Test | |||
| 2010 | 25.0% | 37.0% | 31.0% |
| 2009 | 39.0% | 45.0% | 28.0% |
| 2008 | 28.0% | 35.0% | 25.0% |
| CST Algebra II Test | |||
| 2010 | 28.0% | 33.0% | 31.0% |
| 2009 | 23.0% | 28.0% | 28.0% |
| 2008 | 26.0% | 32.0% | 27.0% |
| CST Biology Test | |||
| 2010 | 63.0% | 72.0% | 46.0% |
| 2009 | 63.0% | 72.0% | 42.0% |
| 2008 | 62.0% | 72.0% | 42.0% |
| CST Chemistry Test | |||
| 2010 | 64.0% | 77.0% | 38.0% |
| 2009 | 64.0% | 78.0% | 36.0% |
| 2008 | 49.0% | 72.0% | 32.0% |
| CST Earth Science Test | |||
| 2010 | 74.0% | 72.0% | 33.0% |
| 2009 | 56.0% | 61.0% | 28.0% |
| 2008 | 66.0% | 69.0% | 28.0% |
| CST General Mathematics Test | |||
| 2010 | 28.0% | 27.0% | 27.0% |
| 2009 | 26.0% | 31.0% | 26.0% |
| 2008 | 23.0% | 21.0% | 27.0% |
| CST Geometry Test | |||
| 2010 | 50.0% | 52.0% | 27.0% |
| 2009 | 49.0% | 53.0% | 26.0% |
| 2008 | 49.0% | 47.0% | 24.0% |
| CST Physics Test | |||
| 2010 | 30.0% | 44.0% | 49.0% |
| 2009 | - | - | - |
| 2008 | 31.0% | 50.0% | 43.0% |
| CST Summative High School Math Test | |||
| 2010 | 62.0% | 65.0% | 54.0% |
| 2009 | 57.0% | 60.0% | 50.0% |
| 2008 | 56.0% | 64.0% | 47.0% |
| CST World History Test | |||
| 2010 | 65.0% | 71.0% | 41.0% |
| 2009 | 72.0% | 72.0% | 38.0% |
| 2008 | 65.0% | 68.0% | 33.0% |
Source: CA Department of Education 2009-2010
School Map and Similar Schools Nearby
Click to Activate Map of Nearby School Campuses
Private
Public
This School
Similar Schools Nearby
| Terra Linda High School 9-12 | 1,112 Students | 1.6 miles away | Not Yet Rated | |
| San Rafael High School 9-12 | 921 Students | 3.3 miles away | Not Yet Rated | |
| Redwood High School 9-12 | 1,442 Students | 3.8 miles away | ![]() 5 out of 5 | |
| Tamalpais High School 9-12 | 1,110 Students | 6.8 miles away | Not Yet Rated | |
| Novato High School 9-12 | 1,322 Students | 7.3 miles away | ![]() 5 out of 5 | |
| San Marin High School 9-12 | 950 Students | 9.7 miles away | ![]() 5 out of 5 | |
| Middle College High School 9-12 | 311 Students | 12.6 miles away | ![]() 4 out of 5 | |
Compare This School To Nearby Schools ->
School Community Forum

Join a discussion about Sir Francis Drake High School and talk to others in the community including students, parents, teachers, and administrators.
Popular Discussion Topics
- Admissions and Registration Questions (e.g. Dress Code and Discipline Policy)
- School Calendar and Upcoming Events (e.g. Graduation)
- After School Programs, Extracurricular Activities, and Athletics (e.g. Football)
- News and Announcements (e.g. Yearbook and Class Supply List Details)
- Graduate and Alumni Events (e.g. Organizing Class Reunions)
Navigation
Can't Find What You Are Looking For?
Rankings
Nearby Cities
Sponsored Links
K-12 Articles
The Importance of Ninth Grade
Students who are entering ninth grade do not realize the importance of the critical decisions they...
Teaching Kids to Deal with Peer Pressure
Parents usually become very concerned when they hear the term "peer pressure." However, peer...
Help Your High School Student Create an Impressive Resume
Time has flown. Your teen is in high school and has demonstrated an interest in obtaining a part...


