Dean L. Shively School
1431 North Central Ave, South El Monte, CA 91733 | (626) 580-0610
- Grades: 4-8
- Student Enrollment: 667
Rating
Not Available
Not Available

No Reviews Yet
Find Old Friends From Dean L. Shively School
Use the form below to search for alumni from Dean L. Shively School.
School Description
School Summary and Highlights
- Enrolls 667 elementary school students from grades 4-8
- Ranks 784th out of 2,050 middle schools in CA.
- 2010 Overall School AYP Met Status: No
Additional Contact Information
- Mailing Address: 1431 North Central Ave., South El Monte, CA 91733
School Operational Details
- Title I EligibleAll students of this school are eligible for participation in authorized programs.
School District Details
- Valle Lindo Elementary School District
- Per-Pupil Spending: $8,628
- Students Per Teacher: 15.0
- Enrolled Students: 1,152
Faculty Details and Student Enrollment
Students and Faculty
- Total Students Enrolled: 667
- Total Full Time "Equivalent" Teachers: 23.0
- Average Student-To-Teacher Ratio: 29.0
Students Gender Breakdown
- Males: 307 (46.0%)
- Females: 360 (54.0%)
Free Lunch Student Eligibility Breakdown
- Eligible for Reduced Lunch: 94 (14.1%)
- Eligible for Free Lunch: 413 (61.9%)
- Eligible for Either Reduced or Free Lunch: 507 (76.0%)
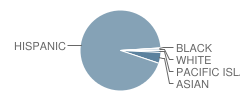
Student Enrollment Distribution by Race / Ethnicity
| Number | Percent | |
|---|---|---|
| American Indian | - | - |
| Black | 1 | 0.1% |
| Asian | 29 | 4.3% |
| Hispanic | 623 | 93.4% |
| White | 6 | 0.9% |
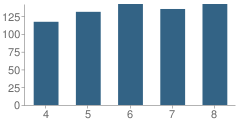
Number of Students Per Grade
| Number | Percent | |
|---|---|---|
| 4th Grade | 117 | 17.5% |
| 5th Grade | 131 | 19.6% |
| 6th Grade | 142 | 21.3% |
| 7th Grade | 135 | 20.2% |
| 8th Grade | 142 | 21.3% |
Teacher Education Background (2009)
Percent With Master's Degree: 25.9%
Percent With Bachelor's Degree: 18.5%
Teacher Credentials & Experience (2009)
Percent of Teachers With Credentials: 100.0%
Number of Certificated Staff: 27.0
Average Number of Years of Teacher Experience: 9.0
Average Age
School:
36.6
District:
44.0
Source: CA Department of Education, Source: NCES 2009-2010
School Ratings and Reviews
Be The First To Review Dean L. Shively School!
School Map and Similar Schools Nearby
Click to Activate Map of Nearby School Campuses
Private
Public
This School
Similar Schools Nearby
| New Temple School KG-3 | 485 Students | 0.3 miles away |  5 out of 5 | |
| Monte Vista Elementary School KG-6 | 640 Students | 0.7 miles away | 5 out of 5 | |
| Miramonte Elementary School KG-6 | 563 Students | 0.9 miles away | 5 out of 5 | |
| Cogswell Elementary School KG-6 | 571 Students | 1.0 miles away | 5 out of 5 | |
| Potrero Elementary School KG-8 | 1,000 Students | 1.1 miles away | Not Yet Rated | |
| Wilkerson Elementary School KG-6 | 605 Students | 1.2 miles away |  3.5 out of 5 | |
| New Lexington Elementary School KG-6 | 435 Students | 1.3 miles away | Not Yet Rated | |
| Parkview Elementary School KG-6 | 903 Students | 1.5 miles away | 5 out of 5 | |
| Cortada Elementary School KG-6 | 535 Students | 1.5 miles away | 5 out of 5 | |
| Maxson Elementary School KG-6 | 783 Students | 1.6 miles away | 5 out of 5 | |
Compare This School To Nearby Schools ->
School Community Forum

Join a discussion about Dean L. Shively School and talk to others in the community including students, parents, teachers, and administrators.
Popular Discussion Topics
- Admissions and Registration Questions (e.g. Dress Code and Discipline Policy)
- School Calendar and Upcoming Events (e.g. Graduation)
- After School Programs, Extracurricular Activities, and Athletics (e.g. Football)
- News and Announcements (e.g. Yearbook and Class Supply List Details)
- Graduate and Alumni Events (e.g. Organizing Class Reunions)
Navigation
Can't Find What You Are Looking For?
Rankings
Nearby Cities
Sponsored Links
K-12 Articles

A Cheat Sheet on Cheating
Senior projects are coming due and finals are coming up. Spring has sprung, and with spring comes...
Senior projects are coming due and finals are coming up. Spring has sprung, and with spring comes...

Cutting Class
Depression is a very real problem for today’s youth. When your spirit doesn’t feel good, a lot of...
Depression is a very real problem for today’s youth. When your spirit doesn’t feel good, a lot of...

Helping Your Child Leave the Nest
It’s all come down to this: Eighteen years of good times and bad, and now your baby bird is ready...
It’s all come down to this: Eighteen years of good times and bad, and now your baby bird is ready...