Parkview Elementary School
Rating
Not Available
Not Available

5 out of 5 | 5 Reviews
Find Old Friends From Parkview Elementary School
Use the form below to search for alumni from Parkview Elementary School.
School Description
School Summary and Highlights
- Enrolls 903 elementary school students from grades KG-6
- Ranks 3318th out of 5,423 elementary schools in CA.
- 2010 Overall School AYP Met Status: No
Additional Contact Information
- Mailing Address: 12044 East Elliott Ave., El Monte, CA 91732
School Operational Details
- Title I Eligible
School District Details
- Mountain View Elementary School District
- Per-Pupil Spending: $10,416
- Students Per Teacher: 20.6
- Enrolled Students: 8,346
Faculty Details and Student Enrollment
Students and Faculty
- Total Students Enrolled: 903
- Total Full Time "Equivalent" Teachers: 42.0
- Average Student-To-Teacher Ratio: 21.5
Students Gender Breakdown
- Males: 447 (49.5%)
- Females: 456 (50.5%)
Free Lunch Student Eligibility Breakdown
- Eligible for Reduced Lunch: 109 (12.1%)
- Eligible for Free Lunch: 753 (83.4%)
- Eligible for Either Reduced or Free Lunch: 862 (95.5%)
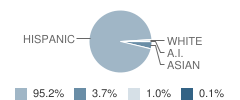
Student Enrollment Distribution by Race / Ethnicity
| Number | Percent | |
|---|---|---|
| American Indian | 1 | 0.1% |
| Black | - | - |
| Asian | 33 | 3.7% |
| Hispanic | 860 | 95.2% |
| White | 9 | 1.0% |
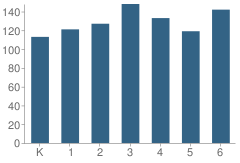
Number of Students Per Grade
| Number | Percent | |
|---|---|---|
| Kindergarten | 113 | 12.5% |
| 1st Grade | 121 | 13.4% |
| 2nd Grade | 127 | 14.1% |
| 3rd Grade | 148 | 16.4% |
| 4th Grade | 133 | 14.7% |
| 5th Grade | 119 | 13.2% |
| 6th Grade | 142 | 15.7% |
Teacher Education Background (2009)
Percent With Ph.D.
School:
2.2%
District:
12.9%
Percent With Master's Degree
School:
41.3%
District:
29.0%
Teacher Credentials & Experience (2009)
Percent of Teachers With Credentials: 100.0%
Number of Certificated Staff: 46.0
Average Number of Years of Teacher Experience: 18.6
Average Age
School:
44.2
District:
44.0
Source: CA Department of Education, Source: NCES 2009-2010
School Ratings and Reviews
Overall Rating: 5

5 out of 5 | 5 Reviews
The Overall Rating is the school's average rating from parents, students, school faculty and staff. The highest rating is five apples and the lowest is one apple.
Share Your Review About This School
5 reviews for Parkview Elementary School
- Reviewed by Student on November 04, 2011
- Rating:
 (5 / 5) Flag as inappropriate
 - parkview school is so cool. i am in the fourth grade. my teacher is mrs.flores. she is so awesome
- Reviewed by Student on March 22, 2011
- Rating: (5 / 5) Flag as inappropriate
- It is a great school. It is very safe and you learn a lot there.
- Reviewed by Former Student on February 12, 2011
- Rating: (5 / 5) Flag as inappropriate
- i have been to this school since kinder to 6th its really great its a safe place and when you ever you need help its there like a friend theres barley any trouble there i have a kid and she goes there she is in 6th grade and her teacher's name is ms.chandler good teacher by the way looking for a good and safe school pick Parkview.Parkview eagles all the way!!!!!!!!!!!!!
- Reviewed by Student on February 12, 2011
- Rating: (5 / 5) Flag as inappropriate
- this school is the best if your looking for school this is the one you should chose
- Reviewed by Former Student on August 31, 2010
- Rating: (5 / 5) Flag as inappropriate
- I truly believe that my strong foundation in learning occurred during my years at this school. Even 14 years after I left 6th grade I have not forgotten the impact my teachers and the staff made on me as a learning young boy. As I begin my fourth year in being a teacher myself, I can look back and say that I am proud to have been a student at Parkview Elementary.
School Map and Similar Schools Nearby
Click to Activate Map of Nearby School Campuses
Private
Public
This School
Similar Schools Nearby
| Willard F. Payne Elementary School KG-6 | 556 Students | 0.3 miles away |  2 out of 5 | |
| Maxson Elementary School KG-6 | 783 Students | 0.5 miles away |  5 out of 5 | |
| Cogswell Elementary School KG-6 | 571 Students | 0.6 miles away | 5 out of 5 | |
| Baker Elementary School KG-5 | 791 Students | 0.8 miles away |  4.5 out of 5 | |
| Miramonte Elementary School KG-6 | 563 Students | 1.0 miles away | 5 out of 5 | |
| Monte Vista Elementary School KG-6 | 640 Students | 1.0 miles away | 5 out of 5 | |
| Jerry Voorhis Elementary School KG-5 | 527 Students | 1.1 miles away |  3 out of 5 | |
| Columbia Elementary School KG-8 | 907 Students | 1.1 miles away | 5 out of 5 | |
| Wilkerson Elementary School KG-6 | 605 Students | 1.2 miles away |  3.5 out of 5 | |
| New Lexington Elementary School KG-6 | 435 Students | 1.2 miles away | Not Yet Rated | |
Compare This School To Nearby Schools ->
School Community Forum

Join a discussion about Parkview Elementary School and talk to others in the community including students, parents, teachers, and administrators.
Popular Discussion Topics
- Admissions and Registration Questions (e.g. Dress Code and Discipline Policy)
- School Calendar and Upcoming Events (e.g. Graduation)
- After School Programs, Extracurricular Activities, and Athletics (e.g. Football)
- News and Announcements (e.g. Yearbook and Class Supply List Details)
- Graduate and Alumni Events (e.g. Organizing Class Reunions)
Navigation
Can't Find What You Are Looking For?
Rankings
Nearby Cities
Sponsored Links
K-12 Articles

How to Get the Best Supplies for Your Money
School supply lists can seem unending, and the price can add up very quickly. But do we really...
School supply lists can seem unending, and the price can add up very quickly. But do we really...

Promoting Childhood Literacy
The number of American adults who are illiterate is astounding. People who lack the ability to read...
The number of American adults who are illiterate is astounding. People who lack the ability to read...

Summer Reading
In 1998, a book was published in the US that turned a hatred of reading to love. “Harry Potter and...
In 1998, a book was published in the US that turned a hatred of reading to love. “Harry Potter and...