De Anza Middle School
Rating
Not Available
Not Available

No Reviews Yet
Find Old Friends From De Anza Middle School
Use the form below to search for alumni from De Anza Middle School.
School Description
School Summary and Highlights
- Enrolls 472 middle school students from grades 6-8
- Ranks 1422nd out of 2,050 middle schools in CA.
- 2010 Overall School AYP Met Status: No
Additional Contact Information
- Mailing Address: 2060 Cameron St., Ventura, CA 93001
School Operational Details
- Title I EligibleAll students of this school are eligible for participation in authorized programs.
School District Details
- Ventura Unified School District
- Per-Pupil Spending: $8,755
- Graduation Rate: 74.9%
- Dropout Rate: 2.4%
- Students Per Teacher: 22.7
- Enrolled Students: 17,484
Faculty Details and Student Enrollment
Students and Faculty
- Total Students Enrolled: 472
- Total Full Time "Equivalent" Teachers: 20.7
- Average Student-To-Teacher Ratio: 22.9
Students Gender Breakdown
- Males: 245 (51.9%)
- Females: 227 (48.1%)
Free Lunch Student Eligibility Breakdown
- Eligible for Reduced Lunch: - (-)
- Eligible for Free Lunch: 469 (99.4%)
- Eligible for Either Reduced or Free Lunch: 469 (99.4%)
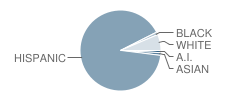
Student Enrollment Distribution by Race / Ethnicity
| Number | Percent | |
|---|---|---|
| American Indian | 4 | 0.8% |
| Black | 5 | 1.1% |
| Asian | 5 | 1.1% |
| Hispanic | 425 | 90.0% |
| White | 30 | 6.4% |
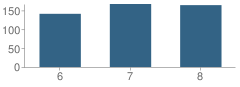
Number of Students Per Grade
| Number | Percent | |
|---|---|---|
| 6th Grade | 141 | 29.9% |
| 7th Grade | 167 | 35.4% |
| 8th Grade | 164 | 34.7% |
Teacher Education Background (2009)
Percent With Bachelor's Degree
School:
9.7%
District:
13.5%
Teacher Credentials & Experience (2009)
Percent of Teachers With Credentials: 100.0%
Number of Certificated Staff: 31.0
Average Number of Years of Teacher Experience: 12.2
Average Age
School:
44.7
District:
46.4
Source: CA Department of Education, Source: NCES 2009-2010
School Ratings and Reviews
Be The First To Review De Anza Middle School!
School Map and Similar Schools Nearby
Click to Activate Map of Nearby School Campuses
Private
Public
This School
Similar Schools Nearby
| Cabrillo Middle School 6-8 | 1,047 Students | 1.8 miles away |  5 out of 5 | |
| Anacapa Middle School 6-8 | 992 Students | 3.3 miles away | Not Yet Rated | |
| Blanche Reynolds Elementary School KG-8 | 391 Students | 3.3 miles away | 5 out of 5 | |
| Balboa Middle School 6-8 | 1,409 Students | 5.1 miles away | Not Yet Rated | |
| Sunset Elementary School KG-8 | 345 Students | 6.1 miles away | Not Yet Rated | |
| Emilie Ritchen Elementary School KG-6 | 783 Students | 7.9 miles away | 5 out of 5 | |
| Sierra Linda Elementary School KG-6 | 667 Students | 8.0 miles away |  1.5 out of 5 | |
| Fremont Intermediate School 7-8 | 1,179 Students | 8.4 miles away |  4.5 out of 5 | |
| Juan Lagunas Soria Elementary School KG-6 | 635 Students | 8.6 miles away | Not Yet Rated | - |
| Curren Elementary School KG-6 | 805 Students | 8.7 miles away | Not Yet Rated | |
Compare This School To Nearby Schools ->
School Community Forum

Join a discussion about De Anza Middle School and talk to others in the community including students, parents, teachers, and administrators.
Popular Discussion Topics
- Admissions and Registration Questions (e.g. Dress Code and Discipline Policy)
- School Calendar and Upcoming Events (e.g. Graduation)
- After School Programs, Extracurricular Activities, and Athletics (e.g. Football)
- News and Announcements (e.g. Yearbook and Class Supply List Details)
- Graduate and Alumni Events (e.g. Organizing Class Reunions)
Navigation
Can't Find What You Are Looking For?
Rankings
Nearby Cities
Sponsored Links
K-12 Articles

Attend Your Teen's Holiday Parties
Christmas and New Years are coming, and with them Christmas and New Years Eve parties. At many of...
Christmas and New Years are coming, and with them Christmas and New Years Eve parties. At many of...

School's out for Recess
Recess used to be the best part of school; that and lunch. But today, a shocking two-thirds of...
Recess used to be the best part of school; that and lunch. But today, a shocking two-thirds of...

Simple Math ... a Simple Gift
Math affects every aspect of our lives-from balancing the checkbook to estimating the amount of...
Math affects every aspect of our lives-from balancing the checkbook to estimating the amount of...