Guajome Park Academy Charter
Rating
Not Available
Not Available

4.5 out of 5 | 2 Reviews
Find Old Friends From Guajome Park Academy Charter
Use the form below to search for alumni from Guajome Park Academy Charter.
School Description
School Summary and Highlights
- Enrolls 1,563 middle and high school students from grades 6-12
- Ranks 512th out of 1,197 high schools in CA.
- 2010 Overall School AYP Met Status: No
Additional Contact Information
- Mailing Address: 2000 North Santa Fe Ave., Vista, CA 92083
School Operational Details
- Charter School
School District Details
- Vista Unified School District
- Per-Pupil Spending: $7,756
- Graduation Rate: 93.2%
- Dropout Rate: 19.4%
- Students Per Teacher: 21.3
- Enrolled Students: 26,083
Faculty Details and Student Enrollment
Students and Faculty
- Total Students Enrolled: 1,563
- Total Full Time "Equivalent" Teachers: 69.0
- Average Student-To-Teacher Ratio: 22.7
Students Gender Breakdown
- Males: 750 (48.0%)
- Females: 813 (52.0%)
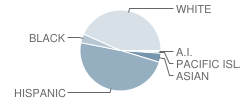
Student Enrollment Distribution by Race / Ethnicity
| Number | Percent | |
|---|---|---|
| American Indian | 10 | 0.6% |
| Black | 56 | 3.6% |
| Asian | 56 | 3.6% |
| Hispanic | 714 | 45.7% |
| White | 639 | 40.9% |
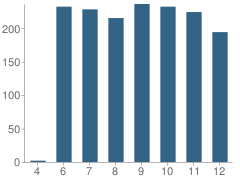
Number of Students Per Grade
| Number | Percent | |
|---|---|---|
| 4th Grade | 2 | 0.1% |
| 6th Grade | 232 | 14.8% |
| 7th Grade | 228 | 14.6% |
| 8th Grade | 215 | 13.8% |
| 9th Grade | 236 | 15.1% |
| 10th Grade | 232 | 14.8% |
| 11th Grade | 224 | 14.3% |
| 12th Grade | 194 | 12.4% |
Graduates Information (2010)
Graduation Rate
School:
87.5%
District:
82.0%
State:
78.6%
Teacher Education Background (2009)
Percent With Ph.D.
School:
2.7%
District:
15.8%
Percent With Master's Degree
School:
2.7%
District:
7.0%
Percent With Bachelor's Degree
School:
8.0%
District:
1.8%
Teacher Credentials & Experience (2009)
Percent of Teachers With Credentials: 95.7%
Number of Certificated Staff: 75.0
Average Number of Years of Teacher Experience: 8.7
Average Age
School:
38.6
District:
49.5
Source: CA Department of Education, Source: NCES 2009-2010
School Ratings and Reviews
Overall Rating: 4.5

4.5 out of 5 | 2 Reviews
The Overall Rating is the school's average rating from parents, students, school faculty and staff. The highest rating is five apples and the lowest is one apple.
Share Your Review About This School
2 reviews for Guajome Park Academy Charter
- Reviewed by Student on May 02, 2010
- Rating:
 (5 / 5) Flag as inappropriate
 - I am a student at GPA and with the help of the staff at GPA have earned 2,000$ Haiti if your are a kid that is better with hands on learning and projects guajome is probably the best place to go. they do many community service projects which i enjoy such as beach clan up and other things. GPA is definitely a top notch school
- Reviewed by Parent/Guardian on October 16, 2009
- Rating:
 (4 / 5) Flag as inappropriate
 - I like the no tolerence and every day curiculum. The kids use their everyday work in daily practical application. Also, they start in the 6th grade (mine did) and the teachers are familiar with the students (usually) all through the 12th grade. I am not comfortable with the community service program though. I often cannot afford to donate money, my health doesn't always permit me to volunteer. That doesn't seem fair when it affects possible college grants and etc..., Mostly, this is a pretty good school. Test scores for the county don't say much, but I see my child individually and her scores are through the roof as well as are her grades. Thank you GPA.
School Map and Similar Schools Nearby
Click to Activate Map of Nearby School Campuses
Private
Public
This School
Similar Schools Nearby
| Siatechnology School 9-12 | 1,850 Students | 2.1 miles away | Not Yet Rated | |
| San Diego Neighborhood Homeschools KG-12 | 13 Students | 3.9 miles away | Not Yet Rated | - |
| Pacific View Charter School KG-12 | 363 Students | 3.9 miles away | Not Yet Rated | |
| Bayshore Preparatory Charter School KG-12 | 162 Students | 6.1 miles away | Not Yet Rated | |
| High Tech High North County School 9-12 | 405 Students | 7.4 miles away | Not Yet Rated | - |
| Dehesa Charter School KG-12 | 955 Students | 10.5 miles away |  5 out of 5 | |
| Classical Academy High 9-12 | 257 Students | 11.9 miles away | Not Yet Rated | |
| Escondido Charter High School 9-12 | 880 Students | 13.0 miles away | 5 out of 5 | |
| Rainbow Advanced Institute for Learning School KG-12 | 136 Students | 14.0 miles away | Not Yet Rated | |
| All Tribes Charter School KG-12 | 50 Students | 17.4 miles away | Not Yet Rated | |
Compare This School To Nearby Schools ->
School Community Forum

Join a discussion about Guajome Park Academy Charter and talk to others in the community including students, parents, teachers, and administrators.
Popular Discussion Topics
- Admissions and Registration Questions (e.g. Dress Code and Discipline Policy)
- School Calendar and Upcoming Events (e.g. Graduation)
- After School Programs, Extracurricular Activities, and Athletics (e.g. Football)
- News and Announcements (e.g. Yearbook and Class Supply List Details)
- Graduate and Alumni Events (e.g. Organizing Class Reunions)
Navigation
Can't Find What You Are Looking For?
Rankings
Nearby Cities
Sponsored Links
K-12 Articles

Cell Phones... the Best Thing Since Sliced Bread or the Worst Invention in the World?
Cell phones are wonderful, the best things humans have ever invented! They help us keep in touch...
Cell phones are wonderful, the best things humans have ever invented! They help us keep in touch...

The Cervical Cancer Vaccine
All across North America girls between the ages of 11 and 12 have the opportunity to be vaccinated...
All across North America girls between the ages of 11 and 12 have the opportunity to be vaccinated...

Helping Young Children with Printing and Cursive Writing
Is your child experiencing difficulty printing or writing? Is he unable to print or write legibly,...
Is your child experiencing difficulty printing or writing? Is he unable to print or write legibly,...