Robert L. Stevens Elementary School
Rating
Not Available
Not Available

5 out of 5 | 1 Review
Find Old Friends From Robert L. Stevens Elementary School
Use the form below to search for alumni from Robert L. Stevens Elementary School.
School Description
School Summary and Highlights
- Enrolls 529 elementary school students from grades KG-6
- Ranks 1371st out of 5,423 elementary schools in CA.
- 2010 Overall School AYP Met Status: No
Additional Contact Information
- Mailing Address: 2345 Giffen Ave., Santa Rosa, CA 95407
School Operational Details
- Title I Eligible
School District Details
- Wright Elementary School District
- Per-Pupil Spending: $8,709
- Students Per Teacher: 20.3
- Enrolled Students: 1,482
Faculty Details and Student Enrollment
Students and Faculty
- Total Students Enrolled: 529
- Total Full Time "Equivalent" Teachers: 26.1
- Average Student-To-Teacher Ratio: 20.3
Students Gender Breakdown
- Males: 262 (49.5%)
- Females: 267 (50.5%)
Free Lunch Student Eligibility Breakdown
- Eligible for Reduced Lunch: 68 (12.9%)
- Eligible for Free Lunch: 340 (64.3%)
- Eligible for Either Reduced or Free Lunch: 408 (77.1%)
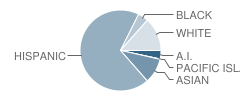
Student Enrollment Distribution by Race / Ethnicity
| Number | Percent | |
|---|---|---|
| American Indian | 18 | 3.4% |
| Black | 22 | 4.2% |
| Asian | 53 | 10.0% |
| Hispanic | 362 | 68.4% |
| White | 71 | 13.4% |
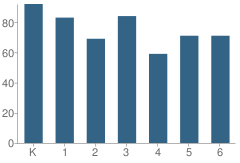
Number of Students Per Grade
| Number | Percent | |
|---|---|---|
| Kindergarten | 92 | 17.4% |
| 1st Grade | 83 | 15.7% |
| 2nd Grade | 69 | 13.0% |
| 3rd Grade | 84 | 15.9% |
| 4th Grade | 59 | 11.2% |
| 5th Grade | 71 | 13.4% |
| 6th Grade | 71 | 13.4% |
Teacher Education Background (2009)
Percent With Master's Degree: 25.8%
Percent With Bachelor's Degree
School:
6.5%
District:
16.7%
Teacher Credentials & Experience (2009)
Percent of Teachers With Credentials: 100.0%
Number of Certificated Staff: 31.0
Average Number of Years of Teacher Experience: 19.6
Average Age
School:
49.2
District:
48.7
Source: CA Department of Education, Source: NCES 2009-2010
School Ratings and Reviews
Overall Rating: 5

5 out of 5 | 1 Review
The Overall Rating is the school's average rating from parents, students, school faculty and staff. The highest rating is five apples and the lowest is one apple.
Share Your Review About This School
1 review for Robert L. Stevens Elementary School
- Reviewed by Student on November 11, 2009
- Rating:
 (5 / 5) Flag as inappropriate
 - this school is the best in the whole wide world!!!!!!
by:nancy frausto
p.s.
hope you remember me mrs.west,and mrs.nygaard
School Map and Similar Schools Nearby
Click to Activate Map of Nearby School Campuses
Private
Public
This School
Similar Schools Nearby
| Sheppard Elementary School KG-6 | 763 Students | 0.7 miles away | Not Yet Rated | |
| Meadow View Elementary School KG-6 | 441 Students | 0.8 miles away |  5 out of 5 | |
| Roseland Elementary School KG-6 | 760 Students | 1.0 miles away | Not Yet Rated | |
| J. X. Wilson Elementary School KG-6 | 538 Students | 1.1 miles away | Not Yet Rated | |
| Bellevue Elementary School KG-6 | 493 Students | 1.5 miles away | 5 out of 5 | |
| Abraham Lincoln Elementary School KG-6 | 399 Students | 1.6 miles away | Not Yet Rated | |
| Luther Burbank Elementary School KG-6 | 327 Students | 1.9 miles away | Not Yet Rated | |
| Taylor Mountain Elementary School KG-6 | 423 Students | 2.1 miles away | Not Yet Rated | - |
| Helen M. Lehman Elementary School KG-6 | 521 Students | 2.2 miles away | Not Yet Rated | |
| Kawana Elementary School KG-6 | 405 Students | 2.3 miles away | Not Yet Rated | |
Compare This School To Nearby Schools ->
School Community Forum

Join a discussion about Robert L. Stevens Elementary School and talk to others in the community including students, parents, teachers, and administrators.
Popular Discussion Topics
- Admissions and Registration Questions (e.g. Dress Code and Discipline Policy)
- School Calendar and Upcoming Events (e.g. Graduation)
- After School Programs, Extracurricular Activities, and Athletics (e.g. Football)
- News and Announcements (e.g. Yearbook and Class Supply List Details)
- Graduate and Alumni Events (e.g. Organizing Class Reunions)
Navigation
Can't Find What You Are Looking For?
Rankings
Nearby Cities
Sponsored Links
K-12 Articles

Teaching Children a Love of History
Parents and grandparents are responsible for teaching children a love of history. To begin, relate...
Parents and grandparents are responsible for teaching children a love of history. To begin, relate...

Adolescents, Sleep and Learning
Recently, adolescent’s sleep habits have been in the news. Research has shown that adolescents need...
Recently, adolescent’s sleep habits have been in the news. Research has shown that adolescents need...

Helping Your Learning Disabled Child
Thousands of children in America struggle to learn on a daily basis. Many of them have invisible...
Thousands of children in America struggle to learn on a daily basis. Many of them have invisible...