Bellevue Elementary School
Rating
Not Available
Not Available

5 out of 5 | 1 Review
Find Old Friends From Bellevue Elementary School
Use the form below to search for alumni from Bellevue Elementary School.
School Description
School Summary and Highlights
- Enrolls 493 elementary school students from grades KG-6
- Ranks 5047th out of 5,423 elementary schools in CA.
- 2010 Overall School AYP Met Status: No
Additional Contact Information
- Mailing Address: 3223 Primrose Ave., Santa Rosa, CA 95407
School Operational Details
- Title I Eligible
School District Details
- Bellevue Union Elementary School District
- Per-Pupil Spending: $9,677
- Students Per Teacher: 18.6
- Enrolled Students: 1,762
Faculty Details and Student Enrollment
Students and Faculty
- Total Students Enrolled: 493
- Total Full Time "Equivalent" Teachers: 28.0
- Average Student-To-Teacher Ratio: 17.6
Students Gender Breakdown
- Males: 235 (47.7%)
- Females: 258 (52.3%)
Free Lunch Student Eligibility Breakdown
- Eligible for Reduced Lunch: 62 (12.6%)
- Eligible for Free Lunch: 397 (80.5%)
- Eligible for Either Reduced or Free Lunch: 459 (93.1%)
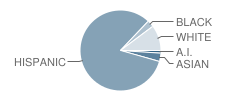
Student Enrollment Distribution by Race / Ethnicity
| Number | Percent | |
|---|---|---|
| American Indian | 5 | 1.0% |
| Black | 13 | 2.6% |
| Asian | 16 | 3.2% |
| Hispanic | 397 | 80.5% |
| White | 49 | 9.9% |
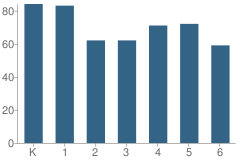
Number of Students Per Grade
| Number | Percent | |
|---|---|---|
| Kindergarten | 84 | 17.0% |
| 1st Grade | 83 | 16.8% |
| 2nd Grade | 62 | 12.6% |
| 3rd Grade | 62 | 12.6% |
| 4th Grade | 71 | 14.4% |
| 5th Grade | 72 | 14.6% |
| 6th Grade | 59 | 12.0% |
Teacher Education Background (2009)
Percent With Bachelor's Degree: 10.3%
Teacher Credentials & Experience (2009)
Percent of Teachers With Emergency Credentials: 3.6%
Percent of Teachers With Credentials: 96.4%
Number of Certificated Staff: 29.0
Average Number of Years of Teacher Experience: 12.8
Average Age
School:
49.3
District:
48.3
Source: CA Department of Education, Source: NCES 2009-2010
School Ratings and Reviews
Overall Rating: 5

5 out of 5 | 1 Review
The Overall Rating is the school's average rating from parents, students, school faculty and staff. The highest rating is five apples and the lowest is one apple.
Share Your Review About This School
1 review for Bellevue Elementary School
- Reviewed by Student on August 09, 2009
- Rating:
 (5 / 5) Flag as inappropriate
 - i ham entering 6th grade and has been at bellvue since k-garden and it is a great school since then
School Map and Similar Schools Nearby
Click to Activate Map of Nearby School Campuses
Private
Public
This School
Similar Schools Nearby
| Meadow View Elementary School KG-6 | 441 Students | 1.1 miles away |  5 out of 5 | |
| Taylor Mountain Elementary School KG-6 | 423 Students | 1.4 miles away | Not Yet Rated | - |
| Robert L. Stevens Elementary School KG-6 | 529 Students | 1.5 miles away | 5 out of 5 | |
| Sheppard Elementary School KG-6 | 763 Students | 1.6 miles away | Not Yet Rated | |
| Roseland Elementary School KG-6 | 760 Students | 2.2 miles away | Not Yet Rated | |
| Kawana Elementary School KG-6 | 405 Students | 2.5 miles away | Not Yet Rated | |
| J. X. Wilson Elementary School KG-6 | 538 Students | 2.6 miles away | Not Yet Rated | |
| Luther Burbank Elementary School KG-6 | 327 Students | 2.8 miles away | Not Yet Rated | |
| Abraham Lincoln Elementary School KG-6 | 399 Students | 3.0 miles away | Not Yet Rated | |
| Gravenstein Elementary School KG-5 | 350 Students | 3.5 miles away | Not Yet Rated | |
Compare This School To Nearby Schools ->
School Community Forum

Join a discussion about Bellevue Elementary School and talk to others in the community including students, parents, teachers, and administrators.
Popular Discussion Topics
- Admissions and Registration Questions (e.g. Dress Code and Discipline Policy)
- School Calendar and Upcoming Events (e.g. Graduation)
- After School Programs, Extracurricular Activities, and Athletics (e.g. Football)
- News and Announcements (e.g. Yearbook and Class Supply List Details)
- Graduate and Alumni Events (e.g. Organizing Class Reunions)
Navigation
Can't Find What You Are Looking For?
Rankings
Nearby Cities
Sponsored Links
K-12 Articles

Those Pesky Little Transitions
Transitions are rarely easy, yet we have to encounter them every day of our lives. For school-aged...
Transitions are rarely easy, yet we have to encounter them every day of our lives. For school-aged...

How to Get the Best Supplies for Your Money
School supply lists can seem unending, and the price can add up very quickly. But do we really...
School supply lists can seem unending, and the price can add up very quickly. But do we really...

When Bad Report Cards Happen to Good Kids
It's mid-term season once again, and semester (or quarter or trimester) grades will be coming out...
It's mid-term season once again, and semester (or quarter or trimester) grades will be coming out...