Riverside Elementary School
Rating
Not Available
Not Available

No Reviews Yet
Find Old Friends From Riverside Elementary School
Use the form below to search for alumni from Riverside Elementary School.
School Description
School Summary and Highlights
- Enrolls 734 preschool and elementary school students from grades PK-5
- Ranks 85th out of 1,322 elementary schools in GA.
School District Details
- Columbia County School District
- Per-Pupil Spending: $8,585
- Graduation Rate: 76.7%
- Dropout Rate: 3.2%
- Students Per Teacher: 15.9
- Enrolled Students: 23,328
Faculty Details and Student Enrollment
Students and Faculty
- Total Students Enrolled: 734
- Total Full Time "Equivalent" Teachers: 47.2
- Average Student-To-Teacher Ratio: 15.6
Students Gender Breakdown
- Males: 385 (52.5%)
- Females: 349 (47.5%)
Free Lunch Student Eligibility Breakdown
- Eligible for Reduced Lunch: 21 (2.9%)
- Eligible for Free Lunch: 50 (6.8%)
- Eligible for Either Reduced or Free Lunch: 71 (9.7%)
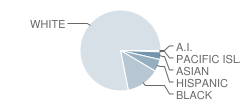
Student Enrollment Distribution by Race / Ethnicity
| Number | Percent | |
|---|---|---|
| American Indian | 3 | 0.4% |
| Black | 94 | 12.8% |
| Asian | 22 | 3.0% |
| Hispanic | 35 | 4.8% |
| White | 546 | 74.4% |
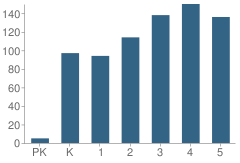
Number of Students Per Grade
| Number | Percent | |
|---|---|---|
| Pre-Kindergarten | 5 | 0.7% |
| Kindergarten | 97 | 13.2% |
| 1st Grade | 94 | 12.8% |
| 2nd Grade | 114 | 15.5% |
| 3rd Grade | 138 | 18.8% |
| 4th Grade | 150 | 20.4% |
| 5th Grade | 136 | 18.5% |
Source: GA Department of Education, Source: NCES 2009-2010
School Ratings and Reviews
Be The First To Review Riverside Elementary School!
School Map and Similar Schools Nearby
Click to Activate Map of Nearby School Campuses
Private
Public
This School
Similar Schools Nearby
| New Elementary #5 School PK-5 | 791 Students | 1.5 miles away | Not Yet Rated | |
| Blue Ridge Elementary School PK-5 | 624 Students | 2.7 miles away | Not Yet Rated | |
| Evans Elementary School PK-5 | 463 Students | 3.2 miles away |  5 out of 5 | |
| Stevens Creek Elementary School PK-5 | 896 Students | 3.4 miles away | 5 out of 5 | |
| South Columbia Elementary School PK-5 | 510 Students | 3.8 miles away |  3.5 out of 5 | |
| Bel Air Elementary School PK-5 | 507 Students | 3.9 miles away |  1 out of 5 | |
| Greenbrier Elementary School PK-5 | 770 Students | 3.9 miles away | Not Yet Rated | |
| Martinez Elementary School PK-5 | 496 Students | 4.9 miles away | Not Yet Rated | |
| Westmont Elementary School PK-5 | 592 Students | 5.6 miles away | Not Yet Rated | |
| Lewiston Elementary School PK-5 | 927 Students | 5.7 miles away | Not Yet Rated | |
Compare This School To Nearby Schools ->
School Community Forum

Join a discussion about Riverside Elementary School and talk to others in the community including students, parents, teachers, and administrators.
Popular Discussion Topics
- Admissions and Registration Questions (e.g. Dress Code and Discipline Policy)
- School Calendar and Upcoming Events (e.g. Graduation)
- After School Programs, Extracurricular Activities, and Athletics (e.g. Football)
- News and Announcements (e.g. Yearbook and Class Supply List Details)
- Graduate and Alumni Events (e.g. Organizing Class Reunions)
Navigation
Can't Find What You Are Looking For?
Nearby Cities
Sponsored Links
K-12 Articles

Just a Harmless Vanilla Bean?
Some of the greatest, most used, and most profitable breakthroughs in science have not been made by...
Some of the greatest, most used, and most profitable breakthroughs in science have not been made by...

Strategies to Help Kids Cope with Stress
Many parents believe that kids don’t experience stress. Nothing could be further from the truth....
Many parents believe that kids don’t experience stress. Nothing could be further from the truth....

The Pros and Cons of Seat Belts in School Buses
Recently the news has been full of school bus accidents where children have been seriously injured...
Recently the news has been full of school bus accidents where children have been seriously injured...