Garvy, J Elementary School
Rating
Not Available
Not Available

No Reviews Yet
Find Old Friends From Garvy, J Elementary School
Use the form below to search for alumni from Garvy, J Elementary School.
School Description
School Summary and Highlights
- Enrolls 656 elementary school students from grades KG-8
- Ranks 308th out of 1,366 middle schools in IL.
Additional Contact Information
- Mailing Address: 5225 N Oak Park Ave, Chicago, IL 60656
- Principal or Admin: Julie A Mcglade
School District Details
- Chicago Public Schools
- Per-Pupil Spending: $10,392
- Graduation Rate: 63.8%
- Dropout Rate: 16.3%
- Students Per Teacher: 17.8
- Enrolled Students: 406,068
Faculty Details and Student Enrollment
Students and Faculty
- Total Students Enrolled: 656
- Total Full Time "Equivalent" Teachers: 36.0
- Average Student-To-Teacher Ratio: 18.2
Students Gender Breakdown
- Males: 343 (52.3%)
- Females: 312 (47.6%)
Free Lunch Student Eligibility Breakdown
- Eligible for Reduced Lunch: 100 (15.2%)
- Eligible for Free Lunch: 189 (28.8%)
- Eligible for Either Reduced or Free Lunch: 289 (44.1%)
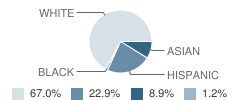
Student Enrollment Distribution by Race / Ethnicity
| Number | Percent | |
|---|---|---|
| American Indian | - | - |
| Black | 8 | 1.2% |
| Asian | 58 | 8.8% |
| Hispanic | 150 | 22.9% |
| White | 439 | 66.9% |
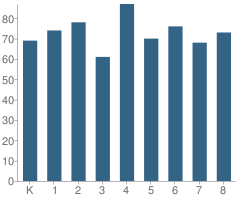
Number of Students Per Grade
| Number | Percent | |
|---|---|---|
| Kindergarten | 69 | 10.5% |
| 1st Grade | 74 | 11.3% |
| 2nd Grade | 78 | 11.9% |
| 3rd Grade | 61 | 9.3% |
| 4th Grade | 87 | 13.3% |
| 5th Grade | 70 | 10.7% |
| 6th Grade | 76 | 11.6% |
| 7th Grade | 68 | 10.4% |
| 8th Grade | 73 | 11.1% |
Attendance, Graduation, and Dropout Rates (2010)
Attendance Rate
School:
96.1%
District:
91.5%
State:
93.9%
Source: IL Department of Education, Source: NCES 2009-2010
School Ratings and Reviews
Be The First To Review Garvy, J Elementary School!
School Map and Similar Schools Nearby
Click to Activate Map of Nearby School Campuses
Private
Public
This School
Similar Schools Nearby
| Beard Elementary School PK-3 | 116 Students | 0.5 miles away |  5 out of 5 | - |
| Union Ridge Elementary School PK-8 | 587 Students | 0.8 miles away | Not Yet Rated | |
| Oriole Park Elementary School PK-8 | 648 Students | 0.8 miles away | Not Yet Rated | |
| Norwood Park Elementary School PK-8 | 376 Students | 0.9 miles away | Not Yet Rated | |
| Hitch Elementary School PK-8 | 478 Students | 1.0 miles away | 5 out of 5 | |
| Onahan Elementary School PK-8 | 634 Students | 1.2 miles away | 5 out of 5 | |
| Smyser Elementary School PK-8 | 979 Students | 1.3 miles away | Not Yet Rated | |
| Prussing Elementary School PK-8 | 660 Students | 1.4 miles away |  3.5 out of 5 | |
| Edison Park Elementary School PK-8 | 339 Students | 1.6 miles away | Not Yet Rated | |
| Farnsworth Elementary School PK-8 | 562 Students | 1.6 miles away | Not Yet Rated | |
Compare This School To Nearby Schools ->
School Community Forum

Join a discussion about Garvy, J Elementary School and talk to others in the community including students, parents, teachers, and administrators.
Popular Discussion Topics
- Admissions and Registration Questions (e.g. Dress Code and Discipline Policy)
- School Calendar and Upcoming Events (e.g. Graduation)
- After School Programs, Extracurricular Activities, and Athletics (e.g. Football)
- News and Announcements (e.g. Yearbook and Class Supply List Details)
- Graduate and Alumni Events (e.g. Organizing Class Reunions)
Navigation
Can't Find What You Are Looking For?
Rankings
Nearby Cities
Sponsored Links
K-12 Articles

Is Your Child's Teacher a Bully?
We’ve all heard about kids being bullied by peers. Kids taunt, tease, pull hair, shove and push...
We’ve all heard about kids being bullied by peers. Kids taunt, tease, pull hair, shove and push...

When Bad Report Cards Happen to Good Kids
It’s mid-term season once again, and semester (or quarter or trimester) grades will be coming out...
It’s mid-term season once again, and semester (or quarter or trimester) grades will be coming out...

Keep Kids Learning All Summer
Early in the 20th century schools in urban districts operated all year ‘round. However, in rural...
Early in the 20th century schools in urban districts operated all year ‘round. However, in rural...