Santee Education Complex School
Rating
Not Available
Not Available

5 out of 5 | 2 Reviews
Find Old Friends From Santee Education Complex School
Use the form below to search for alumni from Santee Education Complex School.
School Description
School Summary and Highlights
- Enrolls 2,857 high school students from grades 9-12
- Ranks 1191st out of 1,197 high schools in CA.
- 2010 Overall School AYP Met Status: No
Additional Contact Information
- Mailing Address: 1921 South Maple Ave., Los Angeles, CA 90011
School Operational Details
- Title I EligibleAll students of this school are eligible for participation in authorized programs.
School District Details
- Los Angeles Unified School District
- Per-Pupil Spending: $11,357
- Graduation Rate: 48.8%
- Dropout Rate: 6.8%
- Students Per Teacher: 21.3
- Enrolled Students: 667,870
Faculty Details and Student Enrollment
Students and Faculty
- Total Students Enrolled: 2,857
- Total Full Time "Equivalent" Teachers: 137.4
- Average Student-To-Teacher Ratio: 20.8
Students Gender Breakdown
- Males: 1,507 (52.7%)
- Females: 1,350 (47.3%)
Free Lunch Student Eligibility Breakdown
- Eligible for Reduced Lunch: 56 (2.0%)
- Eligible for Free Lunch: 2,237 (78.3%)
- Eligible for Either Reduced or Free Lunch: 2,293 (80.3%)
Student Enrollment Distribution by Race / Ethnicity
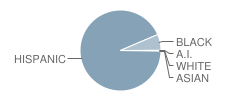
| Number | Percent | |
|---|---|---|
| American Indian | 5 | 0.2% |
| Black | 182 | 6.4% |
| Asian | 2 | 0.07% |
| Hispanic | 2,663 | 93.2% |
| White | 2 | 0.07% |
Number of Students Per Grade
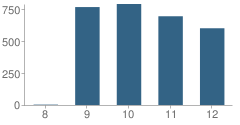
| Number | Percent | |
|---|---|---|
| 8th Grade | 3 | 0.1% |
| 9th Grade | 767 | 26.8% |
| 10th Grade | 791 | 27.7% |
| 11th Grade | 695 | 24.3% |
| 12th Grade | 601 | 21.0% |
Graduates Information (2010)
Graduation Rate
School:
56.3%
District:
69.1%
State:
78.6%
Teacher Education Background (2009)
Percent With Master's Degree
School:
16.1%
District:
26.9%
Percent With Bachelor's Degree
School:
21.2%
District:
31.9%
Percent With Ph.D.
School:
5.2%
District:
3.7%
Teacher Credentials & Experience (2009)
Average Age
School:
43.4
District:
46.7
Average Number of Years of Teacher Experience: 6.7
Number of Certificated Staff: 193.0
Percent of Teachers With Credentials: 92.7%
Source: CA Department of Education, Source: NCES 2009-2010
School Ratings and Reviews
Overall Rating: 5

5 out of 5 | 2 Reviews
The Overall Rating is the school's average rating from parents, students, school faculty and staff. The highest rating is five apples and the lowest is one apple.
Share Your Review About This School
2 reviews for Santee Education Complex School
- Reviewed by Parent/Guardian on March 23, 2010
- Rating:
 (5 / 5) Flag as inappropriate
 - maria zelaya
- Reviewed by Student on June 22, 2009
- Rating: (5 / 5) Flag as inappropriate
- is all about Santee GO FALCONS!!!!
School Map and Similar Schools Nearby
Click to Activate Map of Nearby School Campuses
Private
Public
This School
Similar Schools Nearby
| Student Empowerment Academy 9-12 | 375 Students | 1.5 miles away | Not Yet Rated | - |
| West Adams Preparatory High School 9-12 | 2,618 Students | 1.7 miles away | Not Yet Rated | - |
| Academic Leadership Community School 9-12 | 445 Students | 2.0 miles away | Not Yet Rated | - |
| Manual Arts High School 9-12 | 3,499 Students | 2.2 miles away | Not Yet Rated | |
| Los Angeles Teachers Preparatory Academy 9-12 | 229 Students | 2.3 miles away | Not Yet Rated | - |
| School for the Visual Arts and Humanities 9-12 | 398 Students | 2.3 miles away | Not Yet Rated | - |
| Central La Area New High School #9 9-12 | 1,089 Students | 2.3 miles away | Not Yet Rated | - |
| School of Math and Science 9-12 | 409 Students | 2.4 miles away | Not Yet Rated | - |
| School of Engineering and Technology 9-12 | 403 Students | 2.4 miles away | Not Yet Rated | - |
| Foshay Learning Center School KG-12 | 2,837 Students | 2.6 miles away |  5 out of 5 | |
Compare This School To Nearby Schools ->
School Community Forum

Join a discussion about Santee Education Complex School and talk to others in the community including students, parents, teachers, and administrators.
Popular Discussion Topics
- Admissions and Registration Questions (e.g. Dress Code and Discipline Policy)
- School Calendar and Upcoming Events (e.g. Graduation)
- After School Programs, Extracurricular Activities, and Athletics (e.g. Football)
- News and Announcements (e.g. Yearbook and Class Supply List Details)
- Graduate and Alumni Events (e.g. Organizing Class Reunions)
Navigation
Can't Find What You Are Looking For?
Rankings
Nearby Cities
Sponsored Links
K-12 Articles

The First Day of School
The first day of kindergarten is a rite of passage for any student. Every mother cries and...
The first day of kindergarten is a rite of passage for any student. Every mother cries and...

Exciting School Lunch Ideas
Earlier this week I had reason to drop by my grandsons’ school at lunch time. While waiting for the...
Earlier this week I had reason to drop by my grandsons’ school at lunch time. While waiting for the...

The Impact on Adopted Children at School
Children who are adopted can be affected both academically and socially at school. Many times...
Children who are adopted can be affected both academically and socially at school. Many times...