Weaver High School
Rating
Not Available
Not Available

4.5 out of 5 | 7 Reviews
Find Old Friends From Weaver High School
Use the form below to search for alumni from Weaver High School.
School Description
School Summary and Highlights
- Enrolls 532 middle and high school students from grades 7-12
- Ranks 47th out of 357 high schools in AL.
Additional Contact Information
- Principal or Admin: Ms Frances R Shipp
- Fax: (256) 820-0811
- Website: calhoun.k12.al.us
School Operational Details
- Shared Time School
School District Details
- Calhoun County School District
- Per-Pupil Spending: $8,707
- Graduation Rate: 71.5%
- Dropout Rate: 2.6%
- Students Per Teacher: 17.4
- Enrolled Students: 9,405
Faculty Details and Student Enrollment
Students and Faculty
- Total Students Enrolled: 532
- Total Full Time "Equivalent" Teachers: 28.5
- Average Student-To-Teacher Ratio: 18.7
Students Gender Breakdown
- Males: 274 (51.5%)
- Females: 258 (48.5%)
Free Lunch Student Eligibility Breakdown
- Eligible for Reduced Lunch: 76 (14.3%)
- Eligible for Free Lunch: 235 (44.2%)
- Eligible for Either Reduced or Free Lunch: 311 (58.5%)
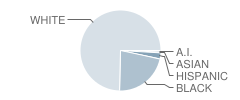
Student Enrollment Distribution by Race / Ethnicity
| Number | Percent | |
|---|---|---|
| American Indian | 3 | 0.6% |
| Black | 117 | 22.0% |
| Asian | 2 | 0.4% |
| Hispanic | 13 | 2.4% |
| White | 397 | 74.6% |
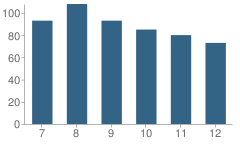
Number of Students Per Grade
| Number | Percent | |
|---|---|---|
| 7th Grade | 93 | 17.5% |
| 8th Grade | 108 | 20.3% |
| 9th Grade | 93 | 17.5% |
| 10th Grade | 85 | 16.0% |
| 11th Grade | 80 | 15.0% |
| 12th Grade | 73 | 13.7% |
Source: AL Department of Education, Source: NCES 2009-2010
School Ratings and Reviews
Overall Rating: 4.5

4.5 out of 5 | 7 Reviews
The Overall Rating is the school's average rating from parents, students, school faculty and staff. The highest rating is five apples and the lowest is one apple.
Share Your Review About This School
7 reviews for Weaver High School
- Reviewed by Former Student on April 07, 2011
- Rating:
 (5 / 5) Flag as inappropriate
 - i think this school need to be ranked in highest rank it is on bugs cause we have a lot of them
- Reviewed by Student on October 04, 2010
- Rating: (5 / 5) Flag as inappropriate
- our school is awesome
- Reviewed by Student on March 01, 2010
- Rating: (5 / 5) Flag as inappropriate
- i love weaver, all my friends go there. i will admit i am a band nerd though. FLUTE FOREVER. i have never gone to any other school. according to every one who has gone to a different school they like weaver the best. i never want to leave. 7th grade is fun, im already scared to graduate
- Reviewed by Parent/Guardian on November 16, 2009
- Rating: (5 / 5) Flag as inappropriate
- im in 6th grade its awesome here i have alot of friends here Logan Bowles
- Reviewed by Student on October 08, 2009
- Rating: (5 / 5) Flag as inappropriate
- i love yall school but i go to the elem im in the sixth grade and im graduating up hope to seee u there brianna merritt
- Reviewed by Parent/Guardian on January 15, 2009
- Rating:
 (3 / 5) Flag as inappropriate
 - I love Weaver. Everyone here is awesome and I have so many friends. I dont want to ever switch schools.
- Reviewed by Student on April 03, 2008
- Rating: (5 / 5) Flag as inappropriate
- weaver is the best school i have went to i amay have moved to alexandria but i can honestly say that weaver is the best school in the state of Alabama and i am proud to say that weaver will always be the school for me and i am proud to say i was one of the band nerds who loves the flute
PROUD BEARCAT FOREVER
Read All 7 Reviews ->
School Map and Similar Schools Nearby
Click to Activate Map of Nearby School Campuses
Private
Public
This School
Similar Schools Nearby
| Alexandria High School 6-12 | 1,009 Students | 2.9 miles away | Not Yet Rated | |
| Saks High School 8-12 | 527 Students | 3.2 miles away | Not Yet Rated | |
| Jacksonville High School 7-12 | 785 Students | 4.9 miles away | Not Yet Rated | |
| Anniston High School 9-12 | 597 Students | 6.2 miles away |  4 out of 5 | |
| Wellborn High School 7-12 | 553 Students | 6.9 miles away | Not Yet Rated | |
| Pleasant Valley High School 7-12 | 455 Students | 7.6 miles away | Not Yet Rated | |
| White Plains High School 9-12 | 367 Students | 9.1 miles away | Not Yet Rated | |
| Ohatchee High School 7-12 | 435 Students | 9.4 miles away |  5 out of 5 | |
| Oxford High School 9-12 | 1,186 Students | 9.5 miles away | 5 out of 5 | |
| Munford High School 9-12 | 462 Students | 16.4 miles away | 4 out of 5 | |
Compare This School To Nearby Schools ->
School Community Forum

Join a discussion about Weaver High School and talk to others in the community including students, parents, teachers, and administrators.
Popular Discussion Topics
- Admissions and Registration Questions (e.g. Dress Code and Discipline Policy)
- School Calendar and Upcoming Events (e.g. Graduation)
- After School Programs, Extracurricular Activities, and Athletics (e.g. Football)
- News and Announcements (e.g. Yearbook and Class Supply List Details)
- Graduate and Alumni Events (e.g. Organizing Class Reunions)
Navigation
Can't Find What You Are Looking For?
Nearby Cities
Sponsored Links
K-12 Articles

Teaching Children with Learning Disabilities to Make Friends
Children with learning disabilities often have trouble making and retaining friendships. Some kids...
Children with learning disabilities often have trouble making and retaining friendships. Some kids...

Break the Cycle: Teen Dating Violence and Prevention Week
February 5 through 9 was "National Teen Dating Violence Awareness and Prevention Week"....
February 5 through 9 was "National Teen Dating Violence Awareness and Prevention Week"....

Teacher Tenure: A Double-Edged Sword
Teacher Tenure (the policy making it almost impossible to fire teachers) has noble roots. It was...
Teacher Tenure (the policy making it almost impossible to fire teachers) has noble roots. It was...