Wellborn High School
Rating
Not Available
Not Available

No Reviews Yet
Find Old Friends From Wellborn High School
Use the form below to search for alumni from Wellborn High School.
School Description
School Summary and Highlights
- Enrolls 553 middle and high school students from grades 7-12
- Ranks 281st out of 357 high schools in AL.
Additional Contact Information
- Principal or Admin: Mr William Richard Carter Jr
- Fax: (256) 237-7071
- Website: www.calhoun.k12.al.us
School Operational Details
- Shared Time School
School District Details
- Calhoun County School District
- Per-Pupil Spending: $8,707
- Graduation Rate: 71.5%
- Dropout Rate: 2.6%
- Students Per Teacher: 17.4
- Enrolled Students: 9,405
Faculty Details and Student Enrollment
Students and Faculty
- Total Students Enrolled: 553
- Total Full Time "Equivalent" Teachers: 32.0
- Average Student-To-Teacher Ratio: 17.3
Students Gender Breakdown
- Males: 273 (49.4%)
- Females: 280 (50.6%)
Free Lunch Student Eligibility Breakdown
- Eligible for Reduced Lunch: 54 (9.8%)
- Eligible for Free Lunch: 313 (56.6%)
- Eligible for Either Reduced or Free Lunch: 367 (66.4%)
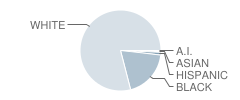
Student Enrollment Distribution by Race / Ethnicity
| Number | Percent | |
|---|---|---|
| American Indian | 2 | 0.4% |
| Black | 106 | 19.2% |
| Asian | 2 | 0.4% |
| Hispanic | 6 | 1.1% |
| White | 437 | 79.0% |
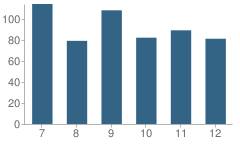
Number of Students Per Grade
| Number | Percent | |
|---|---|---|
| 7th Grade | 114 | 20.6% |
| 8th Grade | 79 | 14.3% |
| 9th Grade | 108 | 19.5% |
| 10th Grade | 82 | 14.8% |
| 11th Grade | 89 | 16.1% |
| 12th Grade | 81 | 14.6% |
Source: AL Department of Education, Source: NCES 2009-2010
School Ratings and Reviews
Be The First To Review Wellborn High School!
School Map and Similar Schools Nearby
Click to Activate Map of Nearby School Campuses
Private
Public
This School
Similar Schools Nearby
| Anniston High School 9-12 | 597 Students | 3.6 miles away |  4 out of 5 | |
| Oxford High School 9-12 | 1,186 Students | 4.1 miles away |  5 out of 5 | |
| Saks High School 8-12 | 527 Students | 4.3 miles away | Not Yet Rated | |
| Weaver High School 7-12 | 532 Students | 6.9 miles away |  4.5 out of 5 | |
| Alexandria High School 6-12 | 1,009 Students | 8.4 miles away | Not Yet Rated | |
| Munford High School 9-12 | 462 Students | 9.5 miles away | 4 out of 5 | |
| Jacksonville High School 7-12 | 785 Students | 11.3 miles away | Not Yet Rated | |
| Ohatchee High School 7-12 | 435 Students | 11.4 miles away | 5 out of 5 | |
| White Plains High School 9-12 | 367 Students | 13.0 miles away | Not Yet Rated | |
| Pleasant Valley High School 7-12 | 455 Students | 14.5 miles away | Not Yet Rated | |
Compare This School To Nearby Schools ->
School Community Forum

Join a discussion about Wellborn High School and talk to others in the community including students, parents, teachers, and administrators.
Popular Discussion Topics
- Admissions and Registration Questions (e.g. Dress Code and Discipline Policy)
- School Calendar and Upcoming Events (e.g. Graduation)
- After School Programs, Extracurricular Activities, and Athletics (e.g. Football)
- News and Announcements (e.g. Yearbook and Class Supply List Details)
- Graduate and Alumni Events (e.g. Organizing Class Reunions)
Navigation
Can't Find What You Are Looking For?
Nearby Cities
Sponsored Links
K-12 Articles

Strategies to Help Kids Cope with Stress
Many parents believe that kids don’t experience stress. Nothing could be further from the truth....
Many parents believe that kids don’t experience stress. Nothing could be further from the truth....

Parent-Teacher Conference Dos and Don'ts
Finals are over and done, and grades have arrived. Now comes the dreaded time to discuss the...
Finals are over and done, and grades have arrived. Now comes the dreaded time to discuss the...

Nothing New Under the Sun
“I had to go through the same thing when I went to school.” Every parent has uttered this phrase,...
“I had to go through the same thing when I went to school.” Every parent has uttered this phrase,...