Washington Arts and Technology East School
12325 East Grace Ave, Spokane Valley, WA 99216 | (509) 924-1830
- Grades: KG-12
- Student Enrollment: 421
Rating
Not Available
Not Available

No Reviews Yet
Find Old Friends From Washington Arts and Technology East School
Use the form below to search for alumni from Washington Arts and Technology East School.
School Description
School Summary and Highlights
- Enrolls 421 elementary, middle, and high school students from grades KG-12
Additional Contact Information
- Mailing Address: 12325 E Grace Ave, Spokane Valley, WA 99216
School Operational Details
- Alternative School
School District Details
- East Valley School District (Spokane)
- Per-Pupil Spending: $8,824
- Graduation Rate: 77.4%
- Dropout Rate: 5.5%
- Students Per Teacher: 19.8
- Enrolled Students: 4,422
Faculty Details and Student Enrollment
Students and Faculty
- Total Students Enrolled: 421
- Total Full Time "Equivalent" Teachers: 1.0
- Average Student-To-Teacher Ratio: 421.0
Students Gender Breakdown
- Males: 196 (46.6%)
- Females: 195 (46.3%)
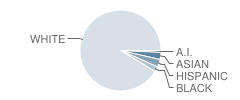
Student Enrollment Distribution by Race / Ethnicity
| Number | Percent | |
|---|---|---|
| American Indian | 3 | 0.7% |
| Black | 8 | 1.9% |
| Asian | 11 | 2.6% |
| Hispanic | 12 | 2.9% |
| White | 357 | 84.8% |
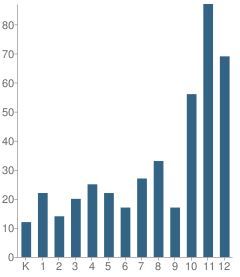
Number of Students Per Grade
| Number | Percent | |
|---|---|---|
| Kindergarten | 12 | 2.9% |
| 1st Grade | 22 | 5.2% |
| 2nd Grade | 14 | 3.3% |
| 3rd Grade | 20 | 4.8% |
| 4th Grade | 25 | 5.9% |
| 5th Grade | 22 | 5.2% |
| 6th Grade | 17 | 4.0% |
| 7th Grade | 27 | 6.4% |
| 8th Grade | 33 | 7.8% |
| 9th Grade | 17 | 4.0% |
| 10th Grade | 56 | 13.3% |
| 11th Grade | 87 | 20.7% |
| 12th Grade | 69 | 16.4% |
Source: WA Department of Education, Source: NCES 2009-2010
School Ratings and Reviews
Be The First To Review Washington Arts and Technology East School!
School Map and Similar Schools Nearby
Click to Activate Map of Nearby School Campuses
Private
Public
This School
Similar Schools Nearby
| Independent Technical Real Access to College & Career School 9-12 | 39 Students | 1.5 miles away | Not Yet Rated | - |
| Cbe Alternative Programs School 9-12 | 361 Students | 2.1 miles away | Not Yet Rated | |
| Spokane Valley Transition School 6-12 | 192 Students | 2.2 miles away | Not Yet Rated | |
| Barker Center School 9-12 | 105 Students | 4.1 miles away | Not Yet Rated | |
| Havermale Alternative School 8-12 | 508 Students | 9.0 miles away | Not Yet Rated | |
| Spokane Juvenile Detention School 6-12 | 26 Students | 9.0 miles away | Not Yet Rated | - |
| Structural Alternative Confinement School 6-12 | 27 Students | 9.0 miles away | Not Yet Rated | - |
| Mead Alternative High School 9-12 | 109 Students | 10.3 miles away | Not Yet Rated | |
| Mead Education Partnership Program School KG-12 | 218 Students | 10.6 miles away | Not Yet Rated | |
| Freeman Columbia Virtual Academy KG-12 | 50 Students | 11.8 miles away | Not Yet Rated | - |
Compare This School To Nearby Schools ->
School Community Forum

Join a discussion about Washington Arts and Technology East School and talk to others in the community including students, parents, teachers, and administrators.
Popular Discussion Topics
- Admissions and Registration Questions (e.g. Dress Code and Discipline Policy)
- School Calendar and Upcoming Events (e.g. Graduation)
- After School Programs, Extracurricular Activities, and Athletics (e.g. Football)
- News and Announcements (e.g. Yearbook and Class Supply List Details)
- Graduate and Alumni Events (e.g. Organizing Class Reunions)
Navigation
Can't Find What You Are Looking For?
Rankings
Nearby Cities
Sponsored Links
K-12 Articles

Teachers Packing Heat
After the recent school shootings (and thwarted school shootings) in the past month-just as after...
After the recent school shootings (and thwarted school shootings) in the past month-just as after...

Imho
I was watching Headline News’s news ticker when I read something that made me LOL. The ticker said...
I was watching Headline News’s news ticker when I read something that made me LOL. The ticker said...

Halloween Safety Tips
Ghosts and witches sit beside mistletoe and tinsel on store shelves. Orange and black deck the...
Ghosts and witches sit beside mistletoe and tinsel on store shelves. Orange and black deck the...