Howenstine High School
Rating
Not Available
Not Available

5 out of 5 | 2 Reviews
Find Old Friends From Howenstine High School
Use the form below to search for alumni from Howenstine High School.
School Description
School Summary and Highlights
- Enrolls 252 high school students from grades 9-12
Additional Contact Information
- Mailing Address: 555 South Tucson Blvd., Tucson, AZ 85716
School Operational Details
- Alternative School
School District Details
- Tucson Unified District
- Per-Pupil Spending: $7,945
- Graduation Rate: 68.8%
- Dropout Rate: 2.5%
- Students Per Teacher: 17.8
- Enrolled Students: 55,379
Faculty Details and Student Enrollment
Students and Faculty
- Total Students Enrolled: 252
- Total Full Time "Equivalent" Teachers: 26.4
- Average Student-To-Teacher Ratio: 9.6
Students Gender Breakdown
- Males: 153 (60.7%)
- Females: 99 (39.3%)
Free Lunch Student Eligibility Breakdown
- Eligible for Reduced Lunch: 19 (7.5%)
- Eligible for Free Lunch: 118 (46.8%)
- Eligible for Either Reduced or Free Lunch: 137 (54.4%)
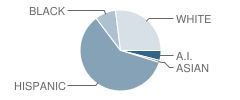
Student Enrollment Distribution by Race / Ethnicity
| Number | Percent | |
|---|---|---|
| American Indian | 10 | 4.0% |
| Black | 21 | 8.3% |
| Asian | 2 | 0.8% |
| Hispanic | 151 | 59.9% |
| White | 68 | 27.0% |
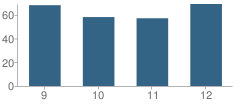
Number of Students Per Grade
| Number | Percent | |
|---|---|---|
| 9th Grade | 68 | 27.0% |
| 10th Grade | 58 | 23.0% |
| 11th Grade | 57 | 22.6% |
| 12th Grade | 69 | 27.4% |
Faculty Educational Background (2006-07)
- Teachers with a Bachelor's Degree: 28%
- Teachers with a Master's Degree or Higher:72%
Faculty Salary and Experience (2006-2007)
- Average Teaching Experience: 10 Years
- Average Salary: $42,638
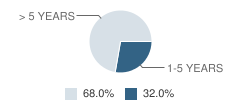
Teacher Experience by Number of Years
| Salary | Percent | |
|---|---|---|
| 1-5 Years of Teaching Experience | $33,531 | 32% |
| More Than 5 Years of Teaching Experience | $46,923 | 68% |
Source: AZ Department of Education, Source: NCES 2009-2010
School Ratings and Reviews
Overall Rating: 5

5 out of 5 | 2 Reviews
The Overall Rating is the school's average rating from parents, students, school faculty and staff. The highest rating is five apples and the lowest is one apple.
Share Your Review About This School
2 reviews for Howenstine High School
- Reviewed by Parent/Guardian on October 20, 2008
- Rating:
 (5 / 5) Flag as inappropriate
 - I was a student here back in the 80's and the same principle is there so that goes to tell you something about the school.. and I am 32 years old now and I also went to Holy spirit to and Sister Loretto is still there.
- Reviewed by Student on August 22, 2007
- Rating: (5 / 5) Flag as inappropriate
- good school
School Map and Similar Schools Nearby
Click to Activate Map of Nearby School Campuses
Private
Public
This School
Similar Schools Nearby
| Broadway Bridge Alternative School 9 | 20 Students | 0.5 miles away | Not Yet Rated | - |
| Pass Alternative High School 9-12 | 93 Students | 0.5 miles away |  5 out of 5 | |
| Pace Alternative School 9-12 | 28 Students | 0.5 miles away | Not Yet Rated | |
| Teenage Parent Program - Tapp School 6-12 | 119 Students | 0.6 miles away |  4 out of 5 | |
| Project More High School 9-12 | 186 Students | 1.3 miles away | Not Yet Rated | |
| Mary Meredith K-12 School KG-12 | 20 Students | 3.3 miles away | Not Yet Rated | - |
| Southwest Alternative High School 9-12 | 48 Students | 10.0 miles away | 4 out of 5 | |
Compare This School To Nearby Schools ->
School Community Forum

Join a discussion about Howenstine High School and talk to others in the community including students, parents, teachers, and administrators.
Popular Discussion Topics
- Admissions and Registration Questions (e.g. Dress Code and Discipline Policy)
- School Calendar and Upcoming Events (e.g. Graduation)
- After School Programs, Extracurricular Activities, and Athletics (e.g. Football)
- News and Announcements (e.g. Yearbook and Class Supply List Details)
- Graduate and Alumni Events (e.g. Organizing Class Reunions)
Navigation
Can't Find What You Are Looking For?
Sponsored Links
K-12 Articles

School Lunches ... Hot or Cold?
First there were four, now there are six, no one knows how many more there may be in the future....
First there were four, now there are six, no one knows how many more there may be in the future....

Internet Safety for Kids of All Ages
Kids are being introduced to the Internet at a very young age. Research for homework and school...
Kids are being introduced to the Internet at a very young age. Research for homework and school...

Summer Safety Tips to Keep Kids Safe
It won’t be long until kids run from the school, shrieking in delight because they’re free for the...
It won’t be long until kids run from the school, shrieking in delight because they’re free for the...