Muskegon Technical Academy
Rating
Not Available
Not Available

No Reviews Yet
Find Old Friends From Muskegon Technical Academy
Use the form below to search for alumni from Muskegon Technical Academy.
School Description
School Summary and Highlights
- Enrolls 212 middle and high school students from grades 6-12
- Ranks 580th out of 672 high schools in MI.
Additional Contact Information
- Mailing Address: 2900 E. Apple, Muskegon, MI 49442
School Operational Details
- Title I Eligible
- Charter School
School District Details
- Muskegon Technical Academy
- Per-Pupil Spending: $7,874
- Graduation Rate: 17.9%
- Dropout Rate: 8.1%
- Students Per Teacher: 13.3
- Enrolled Students: 212
Faculty Details and Student Enrollment
Students and Faculty
- Total Students Enrolled: 212
- Total Full Time "Equivalent" Teachers: 16.0
- Average Student-To-Teacher Ratio: 13.3
Students Gender Breakdown
- Males: 108 (50.9%)
- Females: 104 (49.1%)
Free Lunch Student Eligibility Breakdown
- Eligible for Reduced Lunch: 18 (8.5%)
- Eligible for Free Lunch: 149 (70.3%)
- Eligible for Either Reduced or Free Lunch: 167 (78.8%)
Student Enrollment Distribution by Race / Ethnicity
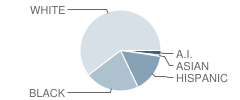
| Number | Percent | |
|---|---|---|
| American Indian | 4 | 1.9% |
| Black | 46 | 21.7% |
| Asian | 1 | 0.5% |
| Hispanic | 33 | 15.6% |
| White | 128 | 60.4% |
Number of Students Per Grade
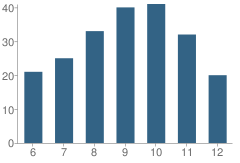
| Number | Percent | |
|---|---|---|
| 6th Grade | 21 | 9.9% |
| 7th Grade | 25 | 11.8% |
| 8th Grade | 33 | 15.6% |
| 9th Grade | 40 | 18.9% |
| 10th Grade | 41 | 19.3% |
| 11th Grade | 32 | 15.1% |
| 12th Grade | 20 | 9.4% |
Source: MI Department of Education, Source: NCES 2009-2010
School Ratings and Reviews
Be The First To Review Muskegon Technical Academy!
School Community Forum

Join a discussion about Muskegon Technical Academy and talk to others in the community including students, parents, teachers, and administrators.
Popular Discussion Topics
- Admissions and Registration Questions (e.g. Dress Code and Discipline Policy)
- School Calendar and Upcoming Events (e.g. Graduation)
- After School Programs, Extracurricular Activities, and Athletics (e.g. Football)
- News and Announcements (e.g. Yearbook and Class Supply List Details)
- Graduate and Alumni Events (e.g. Organizing Class Reunions)
Navigation
Can't Find What You Are Looking For?
Rankings
Nearby Cities
Sponsored Links
K-12 Articles

Breakfast, Kids and Learning
For generations parents have been telling their kids that breakfast is the most important meal of...
For generations parents have been telling their kids that breakfast is the most important meal of...

Nothing New Under the Sun
“I had to go through the same thing when I went to school.” Every parent has uttered this phrase,...
“I had to go through the same thing when I went to school.” Every parent has uttered this phrase,...

School Violence: Can It Be Stopped
It’s a fact that violence in schools is prevalent in today’s society. We hear of school shootings,...
It’s a fact that violence in schools is prevalent in today’s society. We hear of school shootings,...