Litchfield High School
Rating
Not Available
Not Available

No Reviews Yet
Find Old Friends From Litchfield High School
Use the form below to search for alumni from Litchfield High School.
School Description
School Summary and Highlights
- Enrolls 212 middle and high school students from grades 6-12
- Ranks 556th out of 672 high schools in MI.
Additional Contact Information
- Mailing Address: 210 Williams Street, Litchfield, MI 49252
- Principal or Admin: Mr. Craig Lehrke
- Fax: (517) 542-2703
- Website: www.litchfieldschools.com
School Operational Details
- Title I Eligible
School District Details
- Litchfield Community Schools District
- Per-Pupil Spending: $8,454
- Dropout Rate: 26.4%
- Students Per Teacher: 17.7
- Enrolled Students: 342
Faculty Details and Student Enrollment
Students and Faculty
- Total Students Enrolled: 212
- Total Full Time "Equivalent" Teachers: 10.2
- Average Student-To-Teacher Ratio: 20.8
Students Gender Breakdown
- Males: 122 (57.5%)
- Females: 90 (42.5%)
Free Lunch Student Eligibility Breakdown
- Eligible for Reduced Lunch: 35 (16.5%)
- Eligible for Free Lunch: 106 (50.0%)
- Eligible for Either Reduced or Free Lunch: 141 (66.5%)
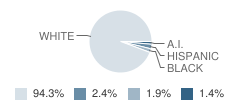
Student Enrollment Distribution by Race / Ethnicity
| Number | Percent | |
|---|---|---|
| American Indian | 3 | 1.4% |
| Black | 4 | 1.9% |
| Asian | - | - |
| Hispanic | 5 | 2.4% |
| White | 200 | 94.3% |
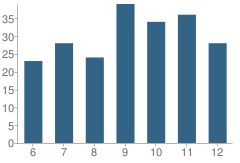
Number of Students Per Grade
| Number | Percent | |
|---|---|---|
| 6th Grade | 23 | 10.8% |
| 7th Grade | 28 | 13.2% |
| 8th Grade | 24 | 11.3% |
| 9th Grade | 39 | 18.4% |
| 10th Grade | 34 | 16.0% |
| 11th Grade | 36 | 17.0% |
| 12th Grade | 28 | 13.2% |
Source: MI Department of Education, Source: NCES 2009-2010
School Ratings and Reviews
Be The First To Review Litchfield High School!
School Map and Similar Schools Nearby
Click to Activate Map of Nearby School Campuses
Private
Public
This School
Similar Schools Nearby
| Jonesville Alternative High School 9-12 | 82 Students | 6.6 miles away | Not Yet Rated | |
| Jonesville High School 9-12 | 364 Students | 7.1 miles away |  5 out of 5 | |
| Homer Community High School 9-12 | 269 Students | 7.4 miles away | Not Yet Rated | |
| Quincy High School 9-12 | 423 Students | 9.6 miles away | Not Yet Rated | |
| Hillsdale ISD School 8-11 | 8 Students | 10.2 miles away | Not Yet Rated | - |
| Concord High School 9-12 | 299 Students | 10.6 miles away | Not Yet Rated | |
| Hillsdale High School 9-12 | 488 Students | 10.7 miles away | 5 out of 5 | |
| Tekonsha High School 9-12 | 105 Students | 12.4 miles away | Not Yet Rated | |
| Hanover-Horton High School 9-12 | 458 Students | 13.1 miles away | Not Yet Rated | |
| North Adams High School 7-12 | 237 Students | 13.1 miles away |  3 out of 5 | |
Compare This School To Nearby Schools ->
School Community Forum

Join a discussion about Litchfield High School and talk to others in the community including students, parents, teachers, and administrators.
Popular Discussion Topics
- Admissions and Registration Questions (e.g. Dress Code and Discipline Policy)
- School Calendar and Upcoming Events (e.g. Graduation)
- After School Programs, Extracurricular Activities, and Athletics (e.g. Football)
- News and Announcements (e.g. Yearbook and Class Supply List Details)
- Graduate and Alumni Events (e.g. Organizing Class Reunions)
Navigation
Can't Find What You Are Looking For?
Rankings
Nearby Cities
Sponsored Links
K-12 Articles

The Importance of Reading for Children Preschool to Grade Three
The first teachers of children are their parents. From the time they are infants, children need to...
The first teachers of children are their parents. From the time they are infants, children need to...

Breakfast, Kids and Learning
For generations parents have been telling their kids that breakfast is the most important meal of...
For generations parents have been telling their kids that breakfast is the most important meal of...

Changing Schools Isn't Easy: Tips for a Successful Transition
It isn’t easy for students to make the transition into a new school, especially if they have...
It isn’t easy for students to make the transition into a new school, especially if they have...