Dinuba High School
Rating
Not Available
Not Available

5 out of 5 | 1 Review
Find Old Friends From Dinuba High School
Use the form below to search for alumni from Dinuba High School.
School Description
School Summary and Highlights
- Enrolls 1,733 high school students from grades 9-12
- Ranks 724th out of 1,197 high schools in CA.
- 2010 Overall School AYP Met Status: No
Additional Contact Information
- Mailing Address: 1327 East El Monte Way, Dinuba, CA 93618
School Operational Details
- Title I EligibleAll students of this school are eligible for participation in authorized programs.
School District Details
- Dinuba Unified School District
- Per-Pupil Spending: $8,832
- Graduation Rate: 82.5%
- Dropout Rate: 1.1%
- Students Per Teacher: 20.2
- Enrolled Students: 5,984
Faculty Details and Student Enrollment
Students and Faculty
- Total Students Enrolled: 1,733
- Total Full Time "Equivalent" Teachers: 82.0
- Average Student-To-Teacher Ratio: 21.1
Students Gender Breakdown
- Males: 876 (50.5%)
- Females: 857 (49.5%)
Free Lunch Student Eligibility Breakdown
- Eligible for Reduced Lunch: - (-)
- Eligible for Free Lunch: 1,559 (90.0%)
- Eligible for Either Reduced or Free Lunch: 1,559 (90.0%)
Student Enrollment Distribution by Race / Ethnicity
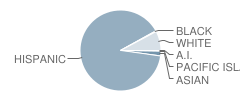
| Number | Percent | |
|---|---|---|
| American Indian | 4 | 0.2% |
| Black | 6 | 0.3% |
| Asian | 33 | 1.9% |
| Hispanic | 1,547 | 89.3% |
| White | 134 | 7.7% |
Number of Students Per Grade
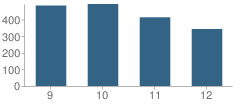
| Number | Percent | |
|---|---|---|
| 9th Grade | 484 | 27.9% |
| 10th Grade | 493 | 28.4% |
| 11th Grade | 413 | 23.8% |
| 12th Grade | 343 | 19.8% |
Graduates Information (2010)
Graduation Rate
School:
91.2%
District:
89.2%
State:
78.6%
Teacher Education Background (2009)
Percent With Master's Degree
School:
21.1%
District:
31.8%
Percent With Bachelor's Degree
School:
7.4%
District:
9.1%
Teacher Credentials & Experience (2009)
Percent of Teachers With Emergency Credentials: 2.4%
Percent of Teachers With Credentials: 94.0%
Number of Certificated Staff: 95.0
Average Number of Years of Teacher Experience: 13.3
Average Age
School:
42.2
District:
46.2
Source: CA Department of Education, Source: NCES 2009-2010
School Ratings and Reviews
Overall Rating: 5

5 out of 5 | 1 Review
The Overall Rating is the school's average rating from parents, students, school faculty and staff. The highest rating is five apples and the lowest is one apple.
Share Your Review About This School
1 review for Dinuba High School
- Reviewed by Parent/Guardian on May 26, 2009
- Rating:
 (5 / 5) Flag as inappropriate
 - not sure
School Map and Similar Schools Nearby
Click to Activate Map of Nearby School Campuses
Private
Public
This School
Similar Schools Nearby
| Orosi High School 9-12 | 1,000 Students | 5.5 miles away | Not Yet Rated | |
| El Monte Junior High School 5-9 | 909 Students | 5.5 miles away | Not Yet Rated | |
| Reedley High School 9-12 | 1,902 Students | 5.7 miles away | Not Yet Rated | |
| Orange Cove High School 9-12 | 665 Students | 6.3 miles away |  5 out of 5 | |
| Kingsburg High School 9-12 | 1,131 Students | 9.2 miles away | Not Yet Rated | |
| Parlier High School 9-12 | 821 Students | 9.3 miles away | Not Yet Rated | |
| Parlier Junior High School 7-8 | 464 Students | 10.0 miles away | Not Yet Rated | |
| Selma High School 9-12 | 1,681 Students | 13.1 miles away | Not Yet Rated | |
| Redwood High School 9-12 | 1,958 Students | 15.4 miles away | Not Yet Rated | |
| Mt. Whitney High School 9-12 | 1,692 Students | 15.9 miles away | Not Yet Rated | |
Compare This School To Nearby Schools ->
School Community Forum

Join a discussion about Dinuba High School and talk to others in the community including students, parents, teachers, and administrators.
Popular Discussion Topics
- Admissions and Registration Questions (e.g. Dress Code and Discipline Policy)
- School Calendar and Upcoming Events (e.g. Graduation)
- After School Programs, Extracurricular Activities, and Athletics (e.g. Football)
- News and Announcements (e.g. Yearbook and Class Supply List Details)
- Graduate and Alumni Events (e.g. Organizing Class Reunions)
Navigation
Can't Find What You Are Looking For?
Rankings
Nearby Cities
Sponsored Links
K-12 Articles

Summer Reading
In 1998, a book was published in the US that turned a hatred of reading to love. "Harry Potter and...
In 1998, a book was published in the US that turned a hatred of reading to love. "Harry Potter and...

Teaching Your Child Study Skills
Many children who have the capability to get good grades experience frustration because of low...
Many children who have the capability to get good grades experience frustration because of low...

Internet Safety for Kids of All Ages
Kids are being introduced to the Internet at a very young age. Research for homework and school...
Kids are being introduced to the Internet at a very young age. Research for homework and school...