Mckinleyville High School

1 out of 5 | 3 Reviews
Find Old Friends From Mckinleyville High School
Use the form below to search for alumni from Mckinleyville High School.
School Description
School Summary and Highlights
- Enrolls 660 high school students from grades 9-12
- Ranks 289th out of 1,197 high schools in CA.
- 2010 Overall School AYP Met Status: Yes
Additional Contact Information
- Mailing Address: 1300 Murray Rd., Mckinleyville, CA 95519
School Operational Details
- Title I Eligible
School District Details
- Northern Humboldt Union High School District
- Per-Pupil Spending: $9,775
- Dropout Rate: 2.6%
- Students Per Teacher: 16.1
- Enrolled Students: 1,679
Faculty Details and Student Enrollment
Students and Faculty
- Total Students Enrolled: 660
- Total Full Time "Equivalent" Teachers: 43.0
- Average Student-To-Teacher Ratio: 15.4
Students Gender Breakdown
- Males: 362 (54.8%)
- Females: 298 (45.2%)
Free Lunch Student Eligibility Breakdown
- Eligible for Reduced Lunch: - (-)
- Eligible for Free Lunch: 300 (45.5%)
- Eligible for Either Reduced or Free Lunch: 300 (45.5%)
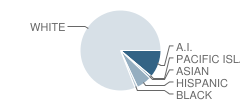
Student Enrollment Distribution by Race / Ethnicity

| Number | Percent | |
|---|---|---|
| American Indian | 73 | 11.1% |
| Black | 7 | 1.1% |
| Asian | 6 | 0.9% |
| Hispanic | 40 | 6.1% |
| White | 532 | 80.6% |
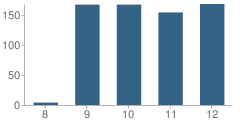
Number of Students Per Grade

| Number | Percent | |
|---|---|---|
| 8th Grade | 4 | 0.6% |
| 9th Grade | 167 | 25.3% |
| 10th Grade | 167 | 25.3% |
| 11th Grade | 154 | 23.3% |
| 12th Grade | 168 | 25.5% |
Graduates Information (2010)
Graduation Rate
School:
95.5%
District:
91.5%
State:
78.6%
Teacher Education Background (2009)
Percent With Ph.D.
School:
2.1%
District:
100.0%
Percent With Master's Degree: 19.1%
Percent With Bachelor's Degree: 14.9%
Teacher Credentials & Experience (2009)
Percent of Teachers With Credentials: 100.0%
Number of Certificated Staff: 47.0
Average Number of Years of Teacher Experience: 10.7
Average Age
School:
39.6
District:
51.0
Source: CA Department of Education, Source: NCES 2009-2010
Sponsored Links
Test Scores and Performance Information
Overall School Rating
How is this determined?
The overall school rating shows that Mckinleyville High School performed on average better than many other schools across the state on CST state exams in the following subjects:
- CST Algebra I
- CST Algebra II
- CST Biology
- CST Chemistry
- CST Earth Science
- CST English-Language Arts
- CST General Mathematics
- CST Geometry
- CST Physics
- CST Science
- CST Summative High School Math
- CST U.S. History
- CST World History
AYP Results (2010)
Overall AYP Met: Yes
ELA AYP Met: Yes
Math AYP Met: Yes
ACT Exam Results (2009)
Percent of Students Taking ACT Exam: 4.8%
SAT Exam Results (2009)
Percent of Students Taking SAT Exam: 24.7%
Average Combined Score: 1,578.1
Critical Reading Average: 539.3
Math Average: 520.0
Writing Average: 518.8
Percent Scoring At or Above 1500: 61.0%
CST - Test Proficiency by Grade and Subject
Grade 9 - % of students at or above proficiency
| School | District | State | |
|---|---|---|---|
| CST Algebra I Test | |||
| 2010 | 34.0% | 39.0% | 22.0% |
| 2009 | 35.0% | 35.0% | 21.0% |
| 2008 | 56.0% | 37.0% | 18.0% |
| CST Biology Test | |||
| 2010 | 63.0% | 71.0% | 55.0% |
| 2009 | 65.0% | 73.0% | 51.0% |
| 2008 | 69.0% | 73.0% | 52.0% |
| CST English-Language Arts Test | |||
| 2010 | 61.0% | 71.0% | 54.0% |
| 2009 | 59.0% | 66.0% | 50.0% |
| 2008 | 65.0% | 67.0% | 49.0% |
| CST Geometry Test | |||
| 2010 | 52.0% | 59.0% | 46.0% |
| 2009 | 47.0% | 54.0% | 47.0% |
| 2008 | 58.0% | 64.0% | 43.0% |
| CST General Mathematics Test | |||
| 2009 | 36.0% | 22.0% | 17.0% |
| 2008 | 39.0% | 33.0% | 18.0% |
Grade 10 - % of students at or above proficiency
| School | District | State | |
|---|---|---|---|
| CST Algebra I Test | |||
| 2010 | 33.0% | 31.0% | 12.0% |
| 2009 | 30.0% | 30.0% | 11.0% |
| 2008 | 28.0% | 24.0% | 9.0% |
| CST Algebra II Test | |||
| 2010 | 20.0% | 25.0% | 40.0% |
| 2009 | 40.0% | 41.0% | 37.0% |
| 2008 | 41.0% | 38.0% | 36.0% |
| CST Biology Test | |||
| 2010 | 54.0% | 59.0% | 38.0% |
| 2009 | 51.0% | 55.0% | 34.0% |
| 2008 | 67.0% | 64.0% | 35.0% |
| CST Chemistry Test | |||
| 2010 | 75.0% | 74.0% | 47.0% |
| 2009 | 48.0% | 65.0% | 44.0% |
| 2008 | 26.0% | 45.0% | 41.0% |
| CST Earth Science Test | |||
| 2010 | 21.0% | 39.0% | 29.0% |
| 2009 | 39.0% | 54.0% | 23.0% |
| 2008 | 57.0% | 64.0% | 23.0% |
| CST English-Language Arts Test | |||
| 2010 | 47.0% | 56.0% | 45.0% |
| 2009 | 60.0% | 60.0% | 44.0% |
| 2008 | 49.0% | 57.0% | 41.0% |
| CST Geometry Test | |||
| 2010 | 14.0% | 24.0% | 14.0% |
| 2009 | 32.0% | 27.0% | 14.0% |
| 2008 | 13.0% | 23.0% | 12.0% |
| CST Science Test | |||
| 2010 | 48.0% | 52.0% | 46.0% |
| 2009 | 51.0% | 55.0% | 44.0% |
| 2008 | 42.0% | 50.0% | 40.0% |
| CST World History Test | |||
| 2010 | 43.0% | 45.0% | 42.0% |
| 2009 | 51.0% | 53.0% | 38.0% |
| 2008 | 46.0% | 50.0% | 33.0% |
Grade 11 - % of students at or above proficiency
| School | District | State | |
|---|---|---|---|
| CST Algebra I Test | |||
| 2010 | 46.0% | 31.0% | 8.0% |
| 2009 | 21.0% | 14.0% | 8.0% |
| 2008 | 30.0% | 17.0% | 5.0% |
| CST Algebra II Test | |||
| 2010 | 8.0% | 11.0% | 14.0% |
| 2009 | 8.0% | 11.0% | 12.0% |
| 2008 | 10.0% | 16.0% | 11.0% |
| CST Biology Test | |||
| 2010 | 54.0% | 73.0% | 46.0% |
| 2009 | 42.0% | 58.0% | 41.0% |
| 2008 | 55.0% | 65.0% | 39.0% |
| CST Chemistry Test | |||
| 2010 | 62.0% | 47.0% | 30.0% |
| 2009 | 63.0% | 51.0% | 27.0% |
| CST Earth Science Test | |||
| 2010 | 42.0% | 35.0% | 32.0% |
| 2009 | 54.0% | 59.0% | 26.0% |
| 2008 | 50.0% | 48.0% | 28.0% |
| CST English-Language Arts Test | |||
| 2010 | 62.0% | 57.0% | 42.0% |
| 2009 | 54.0% | 55.0% | 40.0% |
| 2008 | 42.0% | 40.0% | 37.0% |
| CST Geometry Test | |||
| 2010 | 12.0% | 9.0% | 6.0% |
| 2009 | 19.0% | 22.0% | 7.0% |
| 2008 | 4.0% | 9.0% | 6.0% |
| CST Physics Test | |||
| 2010 | 88.0% | 79.0% | 53.0% |
| 2009 | 80.0% | 68.0% | 50.0% |
| 2008 | 77.0% | 84.0% | 47.0% |
| CST Summative High School Math Test | |||
| 2010 | 51.0% | 62.0% | 50.0% |
| 2009 | 59.0% | 52.0% | 47.0% |
| 2008 | 52.0% | 43.0% | 43.0% |
| CST U.S. History Test | |||
| 2010 | 52.0% | 56.0% | 45.0% |
| 2009 | 55.0% | 56.0% | 44.0% |
| 2008 | 39.0% | 41.0% | 38.0% |
End of Course - % of students at or above proficiency
| School | District | State | |
|---|---|---|---|
| CST Algebra I Test | |||
| 2010 | 35.0% | 36.0% | 31.0% |
| 2009 | 32.0% | 30.0% | 28.0% |
| 2008 | 41.0% | 28.0% | 25.0% |
| CST Algebra II Test | |||
| 2010 | 14.0% | 23.0% | 31.0% |
| 2009 | 23.0% | 29.0% | 28.0% |
| 2008 | 28.0% | 35.0% | 27.0% |
| CST Biology Test | |||
| 2010 | 58.0% | 66.0% | 46.0% |
| 2009 | 56.0% | 62.0% | 42.0% |
| 2008 | 65.0% | 68.0% | 42.0% |
| CST Chemistry Test | |||
| 2010 | 65.0% | 57.0% | 38.0% |
| 2009 | 56.0% | 57.0% | 36.0% |
| 2008 | 24.0% | 44.0% | 32.0% |
| CST Earth Science Test | |||
| 2010 | 33.0% | 40.0% | 33.0% |
| 2009 | 49.0% | 60.0% | 28.0% |
| 2008 | 52.0% | 54.0% | 28.0% |
| CST Geometry Test | |||
| 2010 | 33.0% | 39.0% | 27.0% |
| 2009 | 36.0% | 39.0% | 26.0% |
| 2008 | 32.0% | 39.0% | 24.0% |
| CST Physics Test | |||
| 2010 | 88.0% | 78.0% | 49.0% |
| 2009 | 80.0% | 68.0% | 46.0% |
| 2008 | 67.0% | 79.0% | 43.0% |
| CST Summative High School Math Test | |||
| 2010 | 50.0% | 64.0% | 54.0% |
| 2009 | 60.0% | 58.0% | 50.0% |
| 2008 | 52.0% | 49.0% | 47.0% |
| CST World History Test | |||
| 2010 | 43.0% | 45.0% | 41.0% |
| 2009 | 50.0% | 52.0% | 38.0% |
| 2008 | 45.0% | 48.0% | 33.0% |
| CST General Mathematics Test | |||
| 2009 | 36.0% | 22.0% | 26.0% |
| 2008 | 39.0% | 33.0% | 27.0% |
Source: CA Department of Education 2009-2010
School Map and Similar Schools Nearby
Click to Activate Map of Nearby School Campuses
Private
Public
This School
Similar Schools Nearby
| Arcata High School 9-12 | 834 Students | 5.7 miles away | Not Yet Rated | |
| Eureka High School 9-12 | 1,406 Students | 11.8 miles away | Not Yet Rated | |
| Fortuna Union High School 9-12 | 862 Students | 25.1 miles away | Not Yet Rated | |
| South Fortuna Elementary School KG-10 | 472 Students | 25.5 miles away | Not Yet Rated | |
| Ferndale High School 9-12 | 172 Students | 26.9 miles away | ![]() 3 out of 5 | |
| Hoopa Valley High School 9-12 | 253 Students | 29.1 miles away | ![]() 5 out of 5 | |
Compare This School To Nearby Schools ->
School Community Forum

Join a discussion about Mckinleyville High School and talk to others in the community including students, parents, teachers, and administrators.
Popular Discussion Topics
- Admissions and Registration Questions (e.g. Dress Code and Discipline Policy)
- School Calendar and Upcoming Events (e.g. Graduation)
- After School Programs, Extracurricular Activities, and Athletics (e.g. Football)
- News and Announcements (e.g. Yearbook and Class Supply List Details)
- Graduate and Alumni Events (e.g. Organizing Class Reunions)
Navigation
Can't Find What You Are Looking For?
Rankings
Nearby Cities
Sponsored Links
K-12 Articles
Beating the Summer Slump
"The Summer Slump", teachers call it. It happens every year. It makes its way into lesson plans...
Everyone Loves Going to the Doctor and Dentist
Going to the doctor or dentist can be traumatic for children of all ages. Many adults do not...
Asperger Syndrome: A Developmental Disorder on the Autism Spectrum
Asperger Syndrome, also known as Pervasive Developmental Disorder is on the high functioning end of...


(1 / 5) 
