Charles E. Riley Elementary School
Rating
Not Available
Not Available

No Reviews Yet
Find Old Friends From Charles E. Riley Elementary School
Use the form below to search for alumni from Charles E. Riley Elementary School.
School Description
School Summary and Highlights
- Enrolls 459 preschool and elementary school students from grades PK-6
- Ranks 1430th out of 2,535 elementary schools in NY.
Additional Contact Information
- Mailing Address: 269 E 8th St, Oswego, NY 13126
- Principal or Admin: Randy Richards
School Operational Details
- Title I Eligible
School District Details
- Oswego City School District
- Per-Pupil Spending: $14,715
- Graduation Rate: 70.9%
- Dropout Rate: 3.6%
- Students Per Teacher: 13.1
- Enrolled Students: 4,301
Faculty Details and Student Enrollment
Students and Faculty
- Total Students Enrolled: 459
- Total Full Time "Equivalent" Teachers: 34.0
- Average Student-To-Teacher Ratio: 13.5
Students Gender Breakdown
- Males: 236 (51.4%)
- Females: 223 (48.6%)
Free Lunch Student Eligibility Breakdown
- Eligible for Reduced Lunch: 18 (3.9%)
- Eligible for Free Lunch: 160 (34.9%)
- Eligible for Either Reduced or Free Lunch: 178 (38.8%)
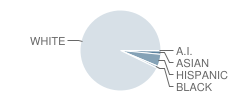
Student Enrollment Distribution by Race / Ethnicity
| Number | Percent | |
|---|---|---|
| American Indian | 1 | 0.2% |
| Black | 4 | 0.9% |
| Asian | 6 | 1.3% |
| Hispanic | 22 | 4.8% |
| White | 426 | 92.8% |
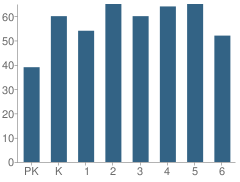
Number of Students Per Grade
| Number | Percent | |
|---|---|---|
| Pre-Kindergarten | 39 | 8.5% |
| Kindergarten | 60 | 13.1% |
| 1st Grade | 54 | 11.8% |
| 2nd Grade | 65 | 14.2% |
| 3rd Grade | 60 | 13.1% |
| 4th Grade | 64 | 13.9% |
| 5th Grade | 65 | 14.2% |
| 6th Grade | 52 | 11.3% |
Public Assistance (2010)
Estimated Percent of Students From Households That Receive Public Assistance: 31-40%
Attendance & Suspensions (2009)
Attendance Rate
School:
94.0%
District:
93.0%
State:
93.0%
Percent of Students Suspended
School:
3.0%
District:
5.0%
State:
5.0%
Teacher Certification & Qualifications (2010)
Percent of Teachers Without a Valid Teaching Certificate: 3.0%
Percent of Teachers Out of Certification
School:
6.0%
District:
1.0%
Percent of Classes Taught by Teachers Without Appropriate Certification
School:
13.0%
District:
2.0%
Percent of Core Classes Not Being Taught by Highly Qualified Teachers
School:
10.0%
District:
1.0%
Teacher Turnover Rates (2010)
Turnover Rate For All Teachers
School:
3.0%
District:
8.0%
Teacher Experience & Educational Background (2010)
Percent of Teachers with Master's or Ph.D.
School:
9.0%
District:
20.0%
Source: NY Department of Education, Source: NCES 2009-2010
School Ratings and Reviews
Be The First To Review Charles E. Riley Elementary School!
School Map and Similar Schools Nearby
Click to Activate Map of Nearby School Campuses
Private
Public
This School
Similar Schools Nearby
| Kingsford Park Elementary School PK-6 | 428 Students | 0.2 miles away | Not Yet Rated | |
| Leighton Elementary School PK-6 | 494 Students | 0.6 miles away | Not Yet Rated | |
| Fitzhugh Park Elementary School PK-6 | 422 Students | 1.3 miles away | Not Yet Rated | |
| Granby Elementary School KG-6 | 520 Students | 9.1 miles away |  5 out of 5 | |
| Fairley School PK-4 | 637 Students | 9.8 miles away | Not Yet Rated | |
| Kenney Middle School 5-8 | 441 Students | 9.8 miles away | Not Yet Rated | |
| Volney Elementary School KG-6 | 459 Students | 9.9 miles away | 5 out of 5 | |
| New Haven Elementary School KG-4 | 219 Students | 10.0 miles away | Not Yet Rated | |
| Fairgrieve School KG-6 | 569 Students | 10.2 miles away | Not Yet Rated | |
| J.e. Lanigan School KG-6 | 412 Students | 11.1 miles away |  2 out of 5 | |
Compare This School To Nearby Schools ->
School Community Forum

Join a discussion about Charles E. Riley Elementary School and talk to others in the community including students, parents, teachers, and administrators.
Popular Discussion Topics
- Admissions and Registration Questions (e.g. Dress Code and Discipline Policy)
- School Calendar and Upcoming Events (e.g. Graduation)
- After School Programs, Extracurricular Activities, and Athletics (e.g. Football)
- News and Announcements (e.g. Yearbook and Class Supply List Details)
- Graduate and Alumni Events (e.g. Organizing Class Reunions)
Navigation
Can't Find What You Are Looking For?
Rankings
Nearby Cities
Sponsored Links
K-12 Articles

Attend Your Teen's Holiday Parties
Christmas and New Years are coming, and with them Christmas and New Years Eve parties. At many of...
Christmas and New Years are coming, and with them Christmas and New Years Eve parties. At many of...

Simple Math ... a Simple Gift
Math affects every aspect of our lives-from balancing the checkbook to estimating the amount of...
Math affects every aspect of our lives-from balancing the checkbook to estimating the amount of...

Exciting School Lunch Ideas
Earlier this week I had reason to drop by my grandsons’ school at lunch time. While waiting for the...
Earlier this week I had reason to drop by my grandsons’ school at lunch time. While waiting for the...