Burrel Elementary School
Rating
Not Available
Not Available

No Reviews Yet
Find Old Friends From Burrel Elementary School
Use the form below to search for alumni from Burrel Elementary School.
School Description
School Summary and Highlights
- Enrolls 102 elementary school students from grades KG-8
- Ranks 2047th out of 2,050 middle schools in CA.
- 2010 Overall School AYP Met Status: No
Additional Contact Information
- Mailing Address: 16704 South Jameson Ave., Riverdale, CA 93656
School Operational Details
- Title I Eligible
School District Details
- Burrel Union Elementary School District
- Per-Pupil Spending: $11,558
- Students Per Teacher: 16.3
- Enrolled Students: 102
Faculty Details and Student Enrollment
Students and Faculty
- Total Students Enrolled: 102
- Total Full Time "Equivalent" Teachers: 6.3
- Average Student-To-Teacher Ratio: 16.3
Students Gender Breakdown
- Males: 59 (57.8%)
- Females: 43 (42.2%)
Free Lunch Student Eligibility Breakdown
- Eligible for Reduced Lunch: 11 (10.8%)
- Eligible for Free Lunch: 75 (73.5%)
- Eligible for Either Reduced or Free Lunch: 86 (84.3%)
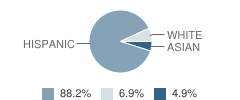
Student Enrollment Distribution by Race / Ethnicity
| Number | Percent | |
|---|---|---|
| American Indian | - | - |
| Black | - | - |
| Asian | 5 | 4.9% |
| Hispanic | 90 | 88.2% |
| White | 7 | 6.9% |
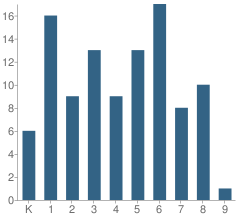
Number of Students Per Grade
| Number | Percent | |
|---|---|---|
| Kindergarten | 6 | 5.9% |
| 1st Grade | 16 | 15.7% |
| 2nd Grade | 9 | 8.8% |
| 3rd Grade | 13 | 12.7% |
| 4th Grade | 9 | 8.8% |
| 5th Grade | 13 | 12.7% |
| 6th Grade | 17 | 16.7% |
| 7th Grade | 8 | 7.8% |
| 8th Grade | 10 | 9.8% |
| 9th Grade | 1 | 1.0% |
Teacher Education Background (2009)
Percent With Master's Degree: 37.5%
Percent With Bachelor's Degree: 12.5%
Teacher Credentials & Experience (2009)
Percent of Teachers With Credentials: 100.0%
Number of Certificated Staff: 8.0
Average Number of Years of Teacher Experience: 10.0
Average Age: 45.6
Source: CA Department of Education, Source: NCES 2009-2010
School Ratings and Reviews
Be The First To Review Burrel Elementary School!
School Map and Similar Schools Nearby
Click to Activate Map of Nearby School Campuses
Private
Public
This School
Similar Schools Nearby
| Riverdale Elementary School 3-8 | 522 Students | 8.1 miles away | Not Yet Rated | |
| Fipps Primary School KG-4 | 442 Students | 8.7 miles away | Not Yet Rated | |
| Raisin City Elementary School KG-8 | 306 Students | 8.8 miles away | Not Yet Rated | |
| Caruthers Elementary School KG-8 | 778 Students | 9.3 miles away | Not Yet Rated | |
| Westside Elementary School KG-8 | 246 Students | 10.7 miles away | Not Yet Rated | |
| American Elementary School KG-8 | 365 Students | 12.8 miles away | Not Yet Rated | |
| Monroe Elementary School KG-8 | 192 Students | 14.9 miles away | Not Yet Rated | |
| Pacific Union Elementary School KG-8 | 361 Students | 15.1 miles away | Not Yet Rated | |
| Washington Colony Elementary School KG-8 | 455 Students | 15.5 miles away | Not Yet Rated | |
| West Park Elementary School KG-8 | 332 Students | 15.7 miles away | Not Yet Rated | |
Compare This School To Nearby Schools ->
School Community Forum

Join a discussion about Burrel Elementary School and talk to others in the community including students, parents, teachers, and administrators.
Popular Discussion Topics
- Admissions and Registration Questions (e.g. Dress Code and Discipline Policy)
- School Calendar and Upcoming Events (e.g. Graduation)
- After School Programs, Extracurricular Activities, and Athletics (e.g. Football)
- News and Announcements (e.g. Yearbook and Class Supply List Details)
- Graduate and Alumni Events (e.g. Organizing Class Reunions)
Navigation
Can't Find What You Are Looking For?
Rankings
Nearby Cities
Sponsored Links
K-12 Articles

Keep Kids Learning All Summer
Early in the 20th century schools in urban districts operated all year `round. However, in rural...
Early in the 20th century schools in urban districts operated all year `round. However, in rural...

Summer Safety Tips to Keep Kids Safe
It won't be long until kids run from the school, shrieking in delight because they're free for the...
It won't be long until kids run from the school, shrieking in delight because they're free for the...

Teacher Tenure: A Double-Edged Sword
Teacher Tenure (the policy making it almost impossible to fire teachers) has noble roots. It was...
Teacher Tenure (the policy making it almost impossible to fire teachers) has noble roots. It was...