Central Unified Alternative / Opportunity School
Rating
Not Available
Not Available

No Reviews Yet
Find Old Friends From Central Unified Alternative / Opportunity School
Use the form below to search for alumni from Central Unified Alternative / Opportunity School.
School Description
School Summary and Highlights
- Enrolls 228 elementary, middle, and high school students from grades KG-12
- 2010 Overall School AYP Met Status: No
School Operational Details
- Alternative School
School District Details
- Central Unified School District
- Per-Pupil Spending: $7,776
- Graduation Rate: 71.9%
- Dropout Rate: 6.2%
- Students Per Teacher: 23.1
- Enrolled Students: 14,547
Faculty Details and Student Enrollment
Students and Faculty
- Total Students Enrolled: 228
- Total Full Time "Equivalent" Teachers: 10.0
- Average Student-To-Teacher Ratio: 22.8
Students Gender Breakdown
- Males: 114 (50.0%)
- Females: 114 (50.0%)
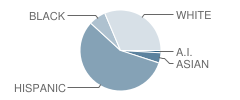
Student Enrollment Distribution by Race / Ethnicity
| Number | Percent | |
|---|---|---|
| American Indian | 2 | 0.9% |
| Black | 15 | 6.6% |
| Asian | 9 | 3.9% |
| Hispanic | 125 | 54.8% |
| White | 69 | 30.3% |
Number of Students Per Grade

| Number | Percent | |
|---|---|---|
| 4th Grade | 1 | 0.4% |
| 5th Grade | 2 | 0.9% |
| 7th Grade | 1 | 0.4% |
| 8th Grade | 4 | 1.8% |
| 9th Grade | 6 | 2.6% |
| 10th Grade | 19 | 8.3% |
| 11th Grade | 56 | 24.6% |
| 12th Grade | 139 | 61.0% |
Graduates Information (2010)
Graduation Rate
School:
73.7%
District:
73.7%
State:
78.6%
Teacher Education Background (2009)
Percent With Bachelor's Degree: 40.0%
Teacher Credentials & Experience (2009)
Percent of Teachers With Credentials: 100.0%
Number of Certificated Staff: 10.0
Average Number of Years of Teacher Experience: 6.9
Average Age: 50.6
Source: CA Department of Education, Source: NCES 2009-2010
School Ratings and Reviews
Be The First To Review Central Unified Alternative / Opportunity School!
School Map and Similar Schools Nearby
Click to Activate Map of Nearby School Campuses
Private
Public
This School
Similar Schools Nearby
| Pathway Community Day School 7-12 | 45 Students | 1.5 miles away | Not Yet Rated | - |
| Teilman Community Day School 7-12 | 100 Students | 3.3 miles away | Not Yet Rated | |
| Design Science Early College High School 9-12 | 222 Students | 4.2 miles away | Not Yet Rated | |
| Dewolf Continuation High School 7-12 | 319 Students | 4.2 miles away | Not Yet Rated | |
| J. E. Young Academic Center School KG-12 | 1,498 Students | 4.4 miles away |  4 out of 5 | |
| Pershing Continuation High School 9-12 | 171 Students | 6.2 miles away | Not Yet Rated | |
| Cambridge Continuation High School 9-12 | 452 Students | 7.6 miles away | Not Yet Rated | |
| Easton Community Day School 9-12 | 8 Students | 9.6 miles away | Not Yet Rated | - |
| Clovis Community Day Secondary School 7-12 | 79 Students | 10.3 miles away | Not Yet Rated | |
| Enterprise Alternative School KG-12 | 158 Students | 10.5 miles away | Not Yet Rated | |
Compare This School To Nearby Schools ->
School Community Forum

Join a discussion about Central Unified Alternative / Opportunity School and talk to others in the community including students, parents, teachers, and administrators.
Popular Discussion Topics
- Admissions and Registration Questions (e.g. Dress Code and Discipline Policy)
- School Calendar and Upcoming Events (e.g. Graduation)
- After School Programs, Extracurricular Activities, and Athletics (e.g. Football)
- News and Announcements (e.g. Yearbook and Class Supply List Details)
- Graduate and Alumni Events (e.g. Organizing Class Reunions)
Navigation
Can't Find What You Are Looking For?
Rankings
Nearby Cities
Sponsored Links
K-12 Articles

Cut the Credit and Save You Some Money
Today’s society glorifies a get-it-now mentality. Children learn this early. You probably noticed...
Today’s society glorifies a get-it-now mentality. Children learn this early. You probably noticed...

Idle Hands
The worst affliction affecting our kids today is not teen pregnancy, drugs and alcohol, or...
The worst affliction affecting our kids today is not teen pregnancy, drugs and alcohol, or...

Special Needs Education: Your Child, Your Rights
Many children today have special needs that make it difficult for them to learn. It’s imperative...
Many children today have special needs that make it difficult for them to learn. It’s imperative...