Chico Junior High School
Rating
Not Available
Not Available

4 out of 5 | 1 Review
Find Old Friends From Chico Junior High School
Use the form below to search for alumni from Chico Junior High School.
School Description
School Summary and Highlights
- Enrolls 595 middle and high school students from grades 7-8
- Ranks 589th out of 2,050 middle schools in CA.
- 2010 Overall School AYP Met Status: No
School Operational Details
- Title I EligibleAll students of this school are eligible for participation in authorized programs.
School District Details
- Chico Unified School District
- Per-Pupil Spending: $8,376
- Graduation Rate: 83.0%
- Dropout Rate: 3.9%
- Students Per Teacher: 23.1
- Enrolled Students: 12,835
Faculty Details and Student Enrollment
Students and Faculty
- Total Students Enrolled: 595
- Total Full Time "Equivalent" Teachers: 26.1
- Average Student-To-Teacher Ratio: 22.8
Students Gender Breakdown
- Males: 307 (51.6%)
- Females: 288 (48.4%)
Free Lunch Student Eligibility Breakdown
- Eligible for Reduced Lunch: 46 (7.7%)
- Eligible for Free Lunch: 278 (46.7%)
- Eligible for Either Reduced or Free Lunch: 324 (54.5%)
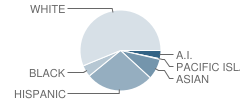
Student Enrollment Distribution by Race / Ethnicity
| Number | Percent | |
|---|---|---|
| American Indian | 20 | 3.4% |
| Black | 28 | 4.7% |
| Asian | 49 | 8.2% |
| Hispanic | 160 | 26.9% |
| White | 329 | 55.3% |
Number of Students Per Grade

| Number | Percent | |
|---|---|---|
| 6th Grade | 13 | 2.2% |
| 7th Grade | 305 | 51.3% |
| 8th Grade | 277 | 46.6% |
Teacher Education Background (2009)
Percent With Master's Degree
School:
17.1%
District:
28.6%
Teacher Credentials & Experience (2009)
Percent of Teachers With Credentials: 100.0%
Number of Certificated Staff: 35.0
Average Number of Years of Teacher Experience: 15.3
Average Age
School:
44.6
District:
50.0
Source: CA Department of Education, Source: NCES 2009-2010
School Ratings and Reviews
Overall Rating: 4

4 out of 5 | 1 Review
The Overall Rating is the school's average rating from parents, students, school faculty and staff. The highest rating is five apples and the lowest is one apple.
Share Your Review About This School
1 review for Chico Junior High School
- Reviewed by Community Member on January 02, 2011
- Rating:
 (4 / 5) Flag as inappropriate
 - 0000
School Map and Similar Schools Nearby
Click to Activate Map of Nearby School Campuses
Private
Public
This School
Similar Schools Nearby
| Chico High School 9-12 | 1,875 Students | 0.3 miles away |  1 out of 5 | |
| Bidwell Junior High School 7-8 | 687 Students | 1.7 miles away | Not Yet Rated | |
| Pleasant Valley High School 9-12 | 1,970 Students | 2.1 miles away | Not Yet Rated | |
| Marsh (Harry M.) Junior High School 7-8 | 582 Students | 2.4 miles away | Not Yet Rated | |
| Durham High School 9-12 | 369 Students | 6.4 miles away | Not Yet Rated | |
| Hamilton High School 9-12 | 323 Students | 9.5 miles away | Not Yet Rated | |
| Paradise High School 9-12 | 1,365 Students | 12.2 miles away |  3.5 out of 5 | |
| Orland High School 9-12 | 666 Students | 18.6 miles away | Not Yet Rated | |
| Oroville High School 9-12 | 1,247 Students | 21.9 miles away | Not Yet Rated | |
| Las Plumas High School 9-12 | 1,418 Students | 23.7 miles away |  5 out of 5 | |
Compare This School To Nearby Schools ->
School Community Forum

Join a discussion about Chico Junior High School and talk to others in the community including students, parents, teachers, and administrators.
Popular Discussion Topics
- Admissions and Registration Questions (e.g. Dress Code and Discipline Policy)
- School Calendar and Upcoming Events (e.g. Graduation)
- After School Programs, Extracurricular Activities, and Athletics (e.g. Football)
- News and Announcements (e.g. Yearbook and Class Supply List Details)
- Graduate and Alumni Events (e.g. Organizing Class Reunions)
Navigation
Can't Find What You Are Looking For?
Rankings
Nearby Cities
Sponsored Links
K-12 Articles

Summer Safety Tips to Keep Kids Safe
It won’t be long until kids run from the school, shrieking in delight because they’re free for the...
It won’t be long until kids run from the school, shrieking in delight because they’re free for the...

A Cheat Sheet on Cheating
Senior projects are coming due and finals are coming up. Spring has sprung, and with spring comes...
Senior projects are coming due and finals are coming up. Spring has sprung, and with spring comes...

Teach Your Child to Write Well
When American children head off to junior kindergarten, they must be ready to learn. It is your...
When American children head off to junior kindergarten, they must be ready to learn. It is your...