Durham High School

No Reviews Yet
Find Old Friends From Durham High School
Use the form below to search for alumni from Durham High School.
School Description
School Summary and Highlights
- Enrolls 369 high school students from grades 9-12
- Ranks 569th out of 1,197 high schools in CA.
- 2010 Overall School AYP Met Status: Yes
Additional Contact Information
- Mailing Address: PO Box 600, Durham, CA 95938
School District Details
- Durham Unified School District
- Per-Pupil Spending: $8,807
- Graduation Rate: 73.9%
- Dropout Rate: 1.3%
- Students Per Teacher: 20.2
- Enrolled Students: 1,069
Faculty Details and Student Enrollment
Students and Faculty
- Total Students Enrolled: 369
- Total Full Time "Equivalent" Teachers: 18.6
- Average Student-To-Teacher Ratio: 19.8
Students Gender Breakdown
- Males: 201 (54.5%)
- Females: 168 (45.5%)
Free Lunch Student Eligibility Breakdown
- Eligible for Reduced Lunch: 44 (11.9%)
- Eligible for Free Lunch: 84 (22.8%)
- Eligible for Either Reduced or Free Lunch: 128 (34.7%)
Student Enrollment Distribution by Race / Ethnicity
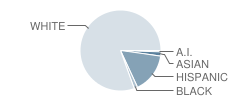
| Number | Percent | |
|---|---|---|
| American Indian | 2 | 0.5% |
| Black | 5 | 1.4% |
| Asian | 6 | 1.6% |
| Hispanic | 57 | 15.4% |
| White | 289 | 78.3% |
Number of Students Per Grade

| Number | Percent | |
|---|---|---|
| 9th Grade | 102 | 27.6% |
| 10th Grade | 86 | 23.3% |
| 11th Grade | 92 | 24.9% |
| 12th Grade | 89 | 24.1% |
Graduates Information (2010)
Graduation Rate
School:
100.0%
District:
97.6%
State:
78.6%
Teacher Education Background (2009)
Percent With Master's Degree
School:
17.4%
District:
16.7%
Percent With Bachelor's Degree
School:
4.3%
District:
33.3%
Teacher Credentials & Experience (2009)
Percent of Teachers With Credentials: 100.0%
Number of Certificated Staff: 23.0
Average Number of Years of Teacher Experience: 17.5
Average Age
School:
45.5
District:
47.0
Source: CA Department of Education, Source: NCES 2009-2010
School Ratings and Reviews
Be The First To Review Durham High School!
Sponsored Links
Test Scores and Performance Information
Overall School Rating
How is this determined?
The overall school rating shows that Durham High School performed on average about the same as other schools across the state on CST state exams in the following subjects:
- CST Algebra I
- CST Algebra II
- CST Biology
- CST Chemistry
- CST Earth Science
- CST English-Language Arts
- CST General Mathematics
- CST Geometry
- CST Science
- CST Summative High School Math
- CST U.S. History
- CST World History
AYP Results (2010)
Overall AYP Met: Yes
ELA AYP Met: Yes
Math AYP Met: Yes
ACT Exam Results (2009)
Percent of Students Taking ACT Exam: 1.1%
SAT Exam Results (2009)
Percent of Students Taking SAT Exam: 38.6%
Average Combined Score: 1,527.9
Critical Reading Average: 494.4
Math Average: 530.6
Writing Average: 502.9
Percent Scoring At or Above 1500: 52.9%
CST - Test Proficiency by Grade and Subject
Grade 9 - % of students at or above proficiency
| School | District | State | |
|---|---|---|---|
| CST Algebra I Test | |||
| 2010 | 22.0% | 22.0% | 22.0% |
| 2009 | 40.0% | 40.0% | 21.0% |
| 2008 | 28.0% | 28.0% | 18.0% |
| CST Biology Test | |||
| 2010 | 62.0% | 62.0% | 55.0% |
| 2009 | 72.0% | 72.0% | 51.0% |
| 2008 | 67.0% | 67.0% | 52.0% |
| CST Earth Science Test | |||
| 2010 | 30.0% | 30.0% | 35.0% |
| 2009 | 22.0% | 22.0% | 29.0% |
| 2008 | 27.0% | 27.0% | 31.0% |
| CST English-Language Arts Test | |||
| 2010 | 51.0% | 51.0% | 54.0% |
| 2009 | 59.0% | 59.0% | 50.0% |
| 2008 | 64.0% | 64.0% | 49.0% |
| CST General Mathematics Test | |||
| 2010 | 6.0% | 6.0% | 17.0% |
| 2009 | 29.0% | 29.0% | 17.0% |
| CST Geometry Test | |||
| 2010 | 31.0% | 31.0% | 46.0% |
| 2009 | 47.0% | 47.0% | 47.0% |
| 2008 | 44.0% | 44.0% | 43.0% |
Grade 10 - % of students at or above proficiency
| School | District | State | |
|---|---|---|---|
| CST Algebra I Test | |||
| 2010 | 13.0% | 13.0% | 12.0% |
| 2009 | 25.0% | 25.0% | 11.0% |
| 2008 | 16.0% | 16.0% | 9.0% |
| CST Algebra II Test | |||
| 2010 | 28.0% | 28.0% | 40.0% |
| 2009 | 36.0% | 36.0% | 37.0% |
| 2008 | 46.0% | 46.0% | 36.0% |
| CST Biology Test | |||
| 2010 | 52.0% | 52.0% | 38.0% |
| 2009 | 58.0% | 58.0% | 34.0% |
| 2008 | 65.0% | 65.0% | 35.0% |
| CST Chemistry Test | |||
| 2010 | 45.0% | 45.0% | 47.0% |
| CST English-Language Arts Test | |||
| 2010 | 51.0% | 51.0% | 45.0% |
| 2009 | 58.0% | 57.0% | 44.0% |
| 2008 | 53.0% | 53.0% | 41.0% |
| CST Geometry Test | |||
| 2010 | 7.0% | 7.0% | 14.0% |
| 2009 | 19.0% | 19.0% | 14.0% |
| 2008 | 15.0% | 15.0% | 12.0% |
| CST Science Test | |||
| 2010 | 49.0% | 49.0% | 46.0% |
| 2009 | 56.0% | 54.0% | 44.0% |
| 2008 | 45.0% | 45.0% | 40.0% |
| CST World History Test | |||
| 2010 | 51.0% | 51.0% | 42.0% |
| 2009 | 46.0% | 44.0% | 38.0% |
| 2008 | 43.0% | 43.0% | 33.0% |
| CST Earth Science Test | |||
| 2008 | 17.0% | 17.0% | 23.0% |
Grade 11 - % of students at or above proficiency
| School | District | State | |
|---|---|---|---|
| CST Biology Test | |||
| 2010 | 40.0% | 40.0% | 46.0% |
| 2009 | 21.0% | 21.0% | 41.0% |
| 2008 | 54.0% | 54.0% | 39.0% |
| CST Chemistry Test | |||
| 2010 | 23.0% | 23.0% | 30.0% |
| 2009 | 34.0% | 34.0% | 27.0% |
| 2008 | 31.0% | 31.0% | 25.0% |
| CST English-Language Arts Test | |||
| 2010 | 45.0% | 44.0% | 42.0% |
| 2009 | 52.0% | 51.0% | 40.0% |
| 2008 | 48.0% | 47.0% | 37.0% |
| CST Summative High School Math Test | |||
| 2010 | 53.0% | 53.0% | 50.0% |
| 2009 | 54.0% | 54.0% | 47.0% |
| 2008 | 46.0% | 46.0% | 43.0% |
| CST U.S. History Test | |||
| 2010 | 51.0% | 48.0% | 45.0% |
| 2009 | 51.0% | 51.0% | 44.0% |
| 2008 | 49.0% | 50.0% | 38.0% |
| CST Algebra II Test | |||
| 2009 | 7.0% | 7.0% | 12.0% |
| CST Earth Science Test | |||
| 2008 | 27.0% | 31.0% | 28.0% |
End of Course - % of students at or above proficiency
| School | District | State | |
|---|---|---|---|
| CST Algebra I Test | |||
| 2010 | 19.0% | 28.0% | 31.0% |
| 2009 | 33.0% | 30.0% | 28.0% |
| 2008 | 22.0% | 23.0% | 25.0% |
| CST Algebra II Test | |||
| 2010 | 13.0% | 13.0% | 31.0% |
| 2009 | 26.0% | 26.0% | 28.0% |
| 2008 | 31.0% | 31.0% | 27.0% |
| CST Biology Test | |||
| 2010 | 55.0% | 55.0% | 46.0% |
| 2009 | 57.0% | 57.0% | 42.0% |
| 2008 | 63.0% | 63.0% | 42.0% |
| CST Chemistry Test | |||
| 2010 | 30.0% | 30.0% | 38.0% |
| 2009 | 30.0% | 30.0% | 36.0% |
| 2008 | 48.0% | 48.0% | 32.0% |
| CST Earth Science Test | |||
| 2010 | 31.0% | 31.0% | 33.0% |
| 2009 | 17.0% | 17.0% | 28.0% |
| 2008 | 24.0% | 25.0% | 28.0% |
| CST General Mathematics Test | |||
| 2010 | 6.0% | 5.0% | 27.0% |
| 2009 | 29.0% | 19.0% | 26.0% |
| CST Geometry Test | |||
| 2010 | 19.0% | 20.0% | 27.0% |
| 2009 | 30.0% | 31.0% | 26.0% |
| 2008 | 24.0% | 24.0% | 24.0% |
| CST Summative High School Math Test | |||
| 2010 | 53.0% | 53.0% | 54.0% |
| 2009 | 52.0% | 52.0% | 50.0% |
| 2008 | 46.0% | 46.0% | 47.0% |
| CST World History Test | |||
| 2010 | 51.0% | 51.0% | 41.0% |
| 2009 | 44.0% | 42.0% | 38.0% |
| 2008 | 41.0% | 41.0% | 33.0% |
Source: CA Department of Education 2009-2010
School Map and Similar Schools Nearby
Click to Activate Map of Nearby School Campuses
Private
Public
This School
Similar Schools Nearby
| Marsh (Harry M.) Junior High School 7-8 | 582 Students | 6.4 miles away | Not Yet Rated | |
| Chico Junior High School 7-8 | 595 Students | 6.4 miles away | ![]() 4 out of 5 | |
| Chico High School 9-12 | 1,875 Students | 6.6 miles away | ![]() 1 out of 5 | |
| Pleasant Valley High School 9-12 | 1,970 Students | 7.9 miles away | Not Yet Rated | |
| Bidwell Junior High School 7-8 | 687 Students | 8.0 miles away | Not Yet Rated | |
| Paradise High School 9-12 | 1,365 Students | 12.8 miles away | ![]() 3.5 out of 5 | |
| Hamilton High School 9-12 | 323 Students | 13.4 miles away | Not Yet Rated | |
| Oroville High School 9-12 | 1,247 Students | 16.5 miles away | Not Yet Rated | |
| Las Plumas High School 9-12 | 1,418 Students | 18.1 miles away | ![]() 5 out of 5 | |
| Princeton Junior-High School 7-12 | 111 Students | 20.2 miles away | Not Yet Rated | |
Compare This School To Nearby Schools ->
School Community Forum

Join a discussion about Durham High School and talk to others in the community including students, parents, teachers, and administrators.
Popular Discussion Topics
- Admissions and Registration Questions (e.g. Dress Code and Discipline Policy)
- School Calendar and Upcoming Events (e.g. Graduation)
- After School Programs, Extracurricular Activities, and Athletics (e.g. Football)
- News and Announcements (e.g. Yearbook and Class Supply List Details)
- Graduate and Alumni Events (e.g. Organizing Class Reunions)
Navigation
Can't Find What You Are Looking For?
Rankings
Nearby Cities
Sponsored Links
K-12 Articles
Strategies to Help Kids Cope with Stress
Many parents believe that kids don't experience stress. Nothing could be further from the truth....
School Violence: Can It Be Stopped
It's a fact that violence in schools is prevalent in today's society. We hear of school shootings,...
Attend Your Teen's Holiday Parties
Christmas and New Years are coming, and with them Christmas and New Years Eve parties. At many of...


