Buchanan High School

5 out of 5 | 1 Review
Find Old Friends From Buchanan High School
Use the form below to search for alumni from Buchanan High School.
School Description
School Summary and Highlights
- Enrolls 2,720 high school students from grades 9-12
- Ranks 77th out of 1,197 high schools in CA.
- 2010 Overall School AYP Met Status: Yes
Additional Contact Information
- Mailing Address: 1560 North Minnewawa Ave., Clovis, CA 93611
School District Details
- Clovis Unified School District
- Per-Pupil Spending: $8,840
- Graduation Rate: 79.4%
- Dropout Rate: 2.1%
- Students Per Teacher: 22.7
- Enrolled Students: 38,002
Faculty Details and Student Enrollment
Students and Faculty
- Total Students Enrolled: 2,720
- Total Full Time "Equivalent" Teachers: 111.0
- Average Student-To-Teacher Ratio: 24.5
Students Gender Breakdown
- Males: 1,375 (50.6%)
- Females: 1,345 (49.4%)
Free Lunch Student Eligibility Breakdown
- Eligible for Reduced Lunch: 125 (4.6%)
- Eligible for Free Lunch: 396 (14.6%)
- Eligible for Either Reduced or Free Lunch: 521 (19.2%)
Student Enrollment Distribution by Race / Ethnicity

| Number | Percent | |
|---|---|---|
| American Indian | 22 | 0.8% |
| Black | 81 | 3.0% |
| Asian | 413 | 15.2% |
| Hispanic | 557 | 20.5% |
| White | 1,600 | 58.8% |
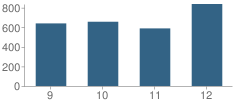
Number of Students Per Grade

| Number | Percent | |
|---|---|---|
| 9th Grade | 639 | 23.5% |
| 10th Grade | 656 | 24.1% |
| 11th Grade | 588 | 21.6% |
| 12th Grade | 837 | 30.8% |
Graduates Information (2010)
Graduation Rate
School:
97.0%
District:
92.4%
State:
78.6%
Teacher Education Background (2009)
Percent With Ph.D.
School:
70.9%
District:
10.1%
Percent With Master's Degree
School:
35.5%
District:
57.3%
Percent With Bachelor's Degree
School:
61.7%
District:
32.6%
Teacher Credentials & Experience (2009)
Percent of Teachers With Emergency Credentials: 2.4%
Percent of Teachers With Credentials: 98.4%
Number of Certificated Staff: 141.0
Average Number of Years of Teacher Experience: 14.1
Average Age
School:
41.8
District:
43.5
Source: CA Department of Education, Source: NCES 2009-2010
Sponsored Links
Test Scores and Performance Information
Overall School Rating
How is this determined?
The overall school rating shows that Buchanan High School performed on average much better than most other schools across the state on CST state exams in the following subjects:
- CST Algebra I
- CST Algebra II
- CST Biology
- CST Chemistry
- CST Earth Science
- CST English-Language Arts
- CST General Mathematics
- CST Geometry
- CST Physics
- CST Science
- CST Summative High School Math
- CST U.S. History
- CST World History
AYP Results (2010)
Overall AYP Met: Yes
ELA AYP Met: Yes
Math AYP Met: Yes
ACT Exam Results (2009)
Percent of Students Taking ACT Exam: 22.6%
Average Combined Score: 24.3
Percent Scoring At or Above 21: 78.5%
SAT Exam Results (2009)
Percent of Students Taking SAT Exam: 50.3%
Average Combined Score: 1,596.1
Critical Reading Average: 526.7
Math Average: 546.2
Writing Average: 523.3
Percent Scoring At or Above 1500: 64.2%
CST - Test Proficiency by Grade and Subject
Grade 9 - % of students at or above proficiency
| School | District | State | |
|---|---|---|---|
| CST Algebra I Test | |||
| 2010 | 36.0% | 40.0% | 22.0% |
| 2009 | 48.0% | 46.0% | 21.0% |
| 2008 | 67.0% | 50.0% | 18.0% |
| CST Algebra II Test | |||
| 2010 | 100.0% | 97.0% | 69.0% |
| 2009 | 100.0% | 96.0% | 65.0% |
| 2008 | 100.0% | 98.0% | 66.0% |
| CST Biology Test | |||
| 2010 | 91.0% | 82.0% | 55.0% |
| 2009 | 96.0% | 79.0% | 51.0% |
| 2008 | 93.0% | 79.0% | 52.0% |
| CST Earth Science Test | |||
| 2010 | 48.0% | 49.0% | 35.0% |
| 2009 | 59.0% | 48.0% | 29.0% |
| 2008 | 55.0% | 45.0% | 31.0% |
| CST English-Language Arts Test | |||
| 2010 | 80.0% | 73.0% | 54.0% |
| 2009 | 79.0% | 69.0% | 50.0% |
| 2008 | 75.0% | 71.0% | 49.0% |
| CST Geometry Test | |||
| 2010 | 62.0% | 65.0% | 46.0% |
| 2009 | 92.0% | 80.0% | 47.0% |
| 2008 | 83.0% | 74.0% | 43.0% |
| CST General Mathematics Test | |||
| 2009 | 46.0% | 39.0% | 17.0% |
| 2008 | 65.0% | 43.0% | 18.0% |
Grade 10 - % of students at or above proficiency
| School | District | State | |
|---|---|---|---|
| CST Algebra I Test | |||
| 2010 | 15.0% | 31.0% | 12.0% |
| 2009 | 25.0% | 27.0% | 11.0% |
| 2008 | 29.0% | 22.0% | 9.0% |
| CST Algebra II Test | |||
| 2010 | 91.0% | 80.0% | 40.0% |
| 2009 | 90.0% | 81.0% | 37.0% |
| 2008 | 85.0% | 74.0% | 36.0% |
| CST Biology Test | |||
| 2010 | 66.0% | 49.0% | 38.0% |
| 2009 | 60.0% | 45.0% | 34.0% |
| 2008 | 63.0% | 49.0% | 35.0% |
| CST Chemistry Test | |||
| 2010 | 88.0% | 65.0% | 47.0% |
| 2009 | 85.0% | 62.0% | 44.0% |
| 2008 | 79.0% | 59.0% | 41.0% |
| CST Earth Science Test | |||
| 2010 | 29.0% | 31.0% | 29.0% |
| 2009 | 34.0% | 33.0% | 23.0% |
| 2008 | 23.0% | 44.0% | 23.0% |
| CST English-Language Arts Test | |||
| 2010 | 74.0% | 60.0% | 45.0% |
| 2009 | 70.0% | 62.0% | 44.0% |
| 2008 | 68.0% | 59.0% | 41.0% |
| CST Geometry Test | |||
| 2010 | 22.0% | 26.0% | 14.0% |
| 2009 | 35.0% | 29.0% | 14.0% |
| 2008 | 31.0% | 24.0% | 12.0% |
| CST Science Test | |||
| 2010 | 78.0% | 60.0% | 46.0% |
| 2009 | 78.0% | 61.0% | 44.0% |
| 2008 | 76.0% | 57.0% | 40.0% |
| CST Summative High School Math Test | |||
| 2010 | 97.0% | 91.0% | 75.0% |
| 2009 | 94.0% | 94.0% | 71.0% |
| 2008 | 88.0% | 84.0% | 68.0% |
| CST World History Test | |||
| 2010 | 64.0% | 53.0% | 42.0% |
| 2009 | 60.0% | 54.0% | 38.0% |
| 2008 | 53.0% | 48.0% | 33.0% |
Grade 11 - % of students at or above proficiency
| School | District | State | |
|---|---|---|---|
| CST Algebra I Test | |||
| 2010 | 7.0% | 17.0% | 8.0% |
| 2009 | 16.0% | 9.0% | 8.0% |
| 2008 | 12.0% | 13.0% | 5.0% |
| CST Algebra II Test | |||
| 2010 | 48.0% | 41.0% | 14.0% |
| 2009 | 49.0% | 43.0% | 12.0% |
| 2008 | 47.0% | 38.0% | 11.0% |
| CST Biology Test | |||
| 2010 | 67.0% | 64.0% | 46.0% |
| 2009 | 55.0% | 55.0% | 41.0% |
| 2008 | 69.0% | 57.0% | 39.0% |
| CST Chemistry Test | |||
| 2010 | 51.0% | 36.0% | 30.0% |
| 2009 | 46.0% | 32.0% | 27.0% |
| 2008 | 45.0% | 40.0% | 25.0% |
| CST English-Language Arts Test | |||
| 2010 | 66.0% | 58.0% | 42.0% |
| 2009 | 62.0% | 52.0% | 40.0% |
| 2008 | 65.0% | 53.0% | 37.0% |
| CST Geometry Test | |||
| 2010 | 10.0% | 11.0% | 6.0% |
| 2009 | 9.0% | 10.0% | 7.0% |
| 2008 | 7.0% | 8.0% | 6.0% |
| CST Physics Test | |||
| 2010 | 74.0% | 59.0% | 53.0% |
| 2009 | 83.0% | 67.0% | 50.0% |
| 2008 | 84.0% | 68.0% | 47.0% |
| CST Summative High School Math Test | |||
| 2010 | 75.0% | 66.0% | 50.0% |
| 2009 | 69.0% | 56.0% | 47.0% |
| 2008 | 68.0% | 57.0% | 43.0% |
| CST U.S. History Test | |||
| 2010 | 69.0% | 61.0% | 45.0% |
| 2009 | 70.0% | 61.0% | 44.0% |
| 2008 | 68.0% | 60.0% | 38.0% |
| CST Earth Science Test | |||
| 2009 | 14.0% | 48.0% | 26.0% |
| CST World History Test | |||
| 2009 | 6.0% | 7.0% | 11.0% |
End of Course - % of students at or above proficiency
| School | District | State | |
|---|---|---|---|
| CST Algebra I Test | |||
| 2010 | 31.0% | 44.0% | 31.0% |
| 2009 | 41.0% | 54.0% | 28.0% |
| 2008 | 51.0% | 51.0% | 25.0% |
| CST Algebra II Test | |||
| 2010 | 66.0% | 58.0% | 31.0% |
| 2009 | 64.0% | 60.0% | 28.0% |
| 2008 | 65.0% | 57.0% | 27.0% |
| CST Biology Test | |||
| 2010 | 74.0% | 64.0% | 46.0% |
| 2009 | 68.0% | 60.0% | 42.0% |
| 2008 | 70.0% | 62.0% | 42.0% |
| CST Chemistry Test | |||
| 2010 | 66.0% | 52.0% | 38.0% |
| 2009 | 58.0% | 50.0% | 36.0% |
| 2008 | 60.0% | 51.0% | 32.0% |
| CST Earth Science Test | |||
| 2010 | 46.0% | 47.0% | 33.0% |
| 2009 | 56.0% | 47.0% | 28.0% |
| 2008 | 52.0% | 47.0% | 28.0% |
| CST Geometry Test | |||
| 2010 | 33.0% | 37.0% | 27.0% |
| 2009 | 39.0% | 38.0% | 26.0% |
| 2008 | 37.0% | 35.0% | 24.0% |
| CST Physics Test | |||
| 2010 | 75.0% | 60.0% | 49.0% |
| 2009 | 83.0% | 65.0% | 46.0% |
| 2008 | 84.0% | 67.0% | 43.0% |
| CST Summative High School Math Test | |||
| 2010 | 79.0% | 70.0% | 54.0% |
| 2009 | 72.0% | 62.0% | 50.0% |
| 2008 | 71.0% | 61.0% | 47.0% |
| CST World History Test | |||
| 2010 | 64.0% | 53.0% | 41.0% |
| 2009 | 58.0% | 54.0% | 38.0% |
| 2008 | 52.0% | 47.0% | 33.0% |
| CST General Mathematics Test | |||
| 2009 | 46.0% | 45.0% | 26.0% |
| 2008 | 65.0% | 61.0% | 27.0% |
Source: CA Department of Education 2009-2010
School Map and Similar Schools Nearby
Click to Activate Map of Nearby School Campuses
Private
Public
This School
Similar Schools Nearby
| Clovis West High School 9-12 | 2,442 Students | 2.8 miles away | ![]() 5 out of 5 | |
| Clovis High School 9-12 | 2,669 Students | 3.2 miles away | ![]() 5 out of 5 | |
| Herbert Hoover High School 9-12 | 1,960 Students | 4.3 miles away | ![]() 3 out of 5 | |
| Erma Duncan Polytechnical High School 9-12 | 988 Students | 5.6 miles away | Not Yet Rated | |
| Clovis East High School 9-12 | 2,301 Students | 5.8 miles away | Not Yet Rated | |
| Bullard High School 9-12 | 2,649 Students | 6.0 miles away | Not Yet Rated | |
| Mclane High School 9-12 | 2,449 Students | 6.1 miles away | Not Yet Rated | |
| Fresno High School 9-12 | 2,676 Students | 8.1 miles away | Not Yet Rated | |
| Roosevelt High School 9-12 | 2,426 Students | 8.2 miles away | Not Yet Rated | |
| Sunnyside High School 9-12 | 3,193 Students | 8.6 miles away | ![]() 4 out of 5 | |
Compare This School To Nearby Schools ->
School Community Forum

Join a discussion about Buchanan High School and talk to others in the community including students, parents, teachers, and administrators.
Popular Discussion Topics
- Admissions and Registration Questions (e.g. Dress Code and Discipline Policy)
- School Calendar and Upcoming Events (e.g. Graduation)
- After School Programs, Extracurricular Activities, and Athletics (e.g. Football)
- News and Announcements (e.g. Yearbook and Class Supply List Details)
- Graduate and Alumni Events (e.g. Organizing Class Reunions)
Navigation
Can't Find What You Are Looking For?
Rankings
Nearby Cities
Sponsored Links
K-12 Articles
Kids and Competition
In the backyard, the classroom, the community and while participating in sports and other...
Helping Your Learning Disabled Child
Thousands of children in America struggle to learn on a daily basis. Many of them have invisible...
Siblings and Individual Identity in High School
When the first day of high school looms in the near future, teens are both excited and anxious....


(5 / 5) 

