Sussman Middle School
Rating
Not Available
Not Available

No Reviews Yet
Find Old Friends From Sussman Middle School
Use the form below to search for alumni from Sussman Middle School.
School Description
School Summary and Highlights
- Enrolls 1,420 middle school students from grades 6-8
- Ranks 1419th out of 2,050 middle schools in CA.
- 2010 Overall School AYP Met Status: No
Additional Contact Information
- Mailing Address: 12500 Birchdale Ave., Downey, CA 90242
School Operational Details
- Title I EligibleAll students of this school are eligible for participation in authorized programs.
School District Details
- Downey Unified School District
- Per-Pupil Spending: $8,562
- Graduation Rate: 80.1%
- Dropout Rate: 2.0%
- Students Per Teacher: 23.7
- Enrolled Students: 22,666
Faculty Details and Student Enrollment
Students and Faculty
- Total Students Enrolled: 1,420
- Total Full Time "Equivalent" Teachers: 63.7
- Average Student-To-Teacher Ratio: 22.3
Students Gender Breakdown
- Males: 733 (51.6%)
- Females: 687 (48.4%)
Free Lunch Student Eligibility Breakdown
- Eligible for Reduced Lunch: 299 (21.1%)
- Eligible for Free Lunch: 801 (56.4%)
- Eligible for Either Reduced or Free Lunch: 1,100 (77.5%)
Student Enrollment Distribution by Race / Ethnicity
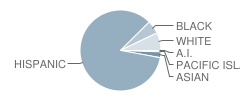
| Number | Percent | |
|---|---|---|
| American Indian | 4 | 0.3% |
| Black | 76 | 5.4% |
| Asian | 34 | 2.4% |
| Hispanic | 1,198 | 84.4% |
| White | 102 | 7.2% |
Number of Students Per Grade
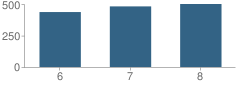
| Number | Percent | |
|---|---|---|
| 6th Grade | 437 | 30.8% |
| 7th Grade | 482 | 33.9% |
| 8th Grade | 501 | 35.3% |
Teacher Education Background (2009)
Percent With Master's Degree
School:
23.5%
District:
25.9%
Percent With Bachelor's Degree
School:
27.9%
District:
10.3%
Teacher Credentials & Experience (2009)
Percent of Teachers With Credentials: 93.7%
Number of Certificated Staff: 68.0
Average Number of Years of Teacher Experience: 12.4
Average Age
School:
38.8
District:
46.5
Source: CA Department of Education, Source: NCES 2009-2010
School Ratings and Reviews
Be The First To Review Sussman Middle School!
School Map and Similar Schools Nearby
Click to Activate Map of Nearby School Campuses
Private
Public
This School
Similar Schools Nearby
| West Middle School 6-8 | 1,426 Students | 1.5 miles away |  5 out of 5 | |
| Albert Baxter Elementary School KG-6 | 554 Students | 1.6 miles away | Not Yet Rated | |
| Paramount Park Middle School 6-8 | 826 Students | 1.8 miles away | Not Yet Rated | - |
| Ernie Pyle Elementary School KG-6 | 558 Students | 2.0 miles away | Not Yet Rated | |
| Hollydale Elementary School KG-8 | 1,127 Students | 2.1 miles away |  4.5 out of 5 | |
| Washington Elementary School KG-6 | 880 Students | 2.1 miles away | 5 out of 5 | |
| Frank E. Woodruff Elementary School KG-6 | 711 Students | 2.1 miles away | Not Yet Rated | |
| East Middle School 6-8 | 1,387 Students | 2.1 miles away | 4.5 out of 5 | |
| Lakeside Middle School 6-8 | 793 Students | 2.4 miles away | 4.5 out of 5 | |
| Bellflower High School 7-12 | 3,116 Students | 2.4 miles away | 5 out of 5 | |
Compare This School To Nearby Schools ->
School Community Forum

Join a discussion about Sussman Middle School and talk to others in the community including students, parents, teachers, and administrators.
Popular Discussion Topics
- Admissions and Registration Questions (e.g. Dress Code and Discipline Policy)
- School Calendar and Upcoming Events (e.g. Graduation)
- After School Programs, Extracurricular Activities, and Athletics (e.g. Football)
- News and Announcements (e.g. Yearbook and Class Supply List Details)
- Graduate and Alumni Events (e.g. Organizing Class Reunions)
Navigation
Can't Find What You Are Looking For?
Rankings
Nearby Cities
Sponsored Links
K-12 Articles

All About Backpacks
Your child riffles through his backpack to find homework assignments, his MP3 player, lunch money...
Your child riffles through his backpack to find homework assignments, his MP3 player, lunch money...

The Importance of Reading for Children Preschool to Grade Three
The first teachers of children are their parents. From the time they are infants, children need to...
The first teachers of children are their parents. From the time they are infants, children need to...

Summer Safety Tips to Keep Kids Safe
It won't be long until kids run from the school, shrieking in delight because they're free for the...
It won't be long until kids run from the school, shrieking in delight because they're free for the...