Taggart John H School
Rating
Not Available
Not Available

5 out of 5 | 1 Review
Find Old Friends From Taggart John H School
Use the form below to search for alumni from Taggart John H School.
School Description
School Summary and Highlights
- Enrolls 453 preschool and elementary school students from grades PK-8
- Ranks 715th out of 875 middle schools in PA.
- 2010 Overall School AYP Met Status: Corrective Action 2 (fifth year)
Additional Contact Information
- Mailing Address: 400 W Porter St, Philadelphia, PA 19148
- Principal or Admin: Stephanie Phillips
School Operational Details
- Title I EligibleAll students of this school are eligible for participation in authorized programs.
School District Details
- Philadelphia City School District
- Per-Pupil Spending: $9,399
- Graduation Rate: 55.5%
- Dropout Rate: 8.5%
- Students Per Teacher: 14.3
- Enrolled Students: 156,790
Faculty Details and Student Enrollment
Students and Faculty
- Total Students Enrolled: 453
- Total Full Time "Equivalent" Teachers: 39.2
- Average Student-To-Teacher Ratio: 11.6
Students Gender Breakdown
- Males: 230 (50.8%)
- Females: 202 (44.6%)
Free Lunch Student Eligibility Breakdown
- Eligible for Reduced Lunch: - (-)
- Eligible for Free Lunch: 418 (92.3%)
- Eligible for Either Reduced or Free Lunch: 418 (92.3%)
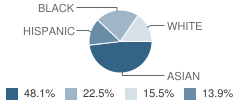
Student Enrollment Distribution by Race / Ethnicity
| Number | Percent | |
|---|---|---|
| American Indian | - | - |
| Black | 97 | 21.4% |
| Asian | 208 | 45.9% |
| Hispanic | 60 | 13.2% |
| White | 67 | 14.8% |
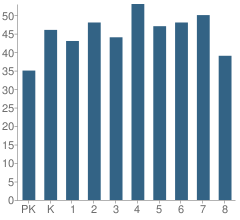
Number of Students Per Grade
| Number | Percent | |
|---|---|---|
| Pre-Kindergarten | 35 | 7.7% |
| Kindergarten | 46 | 10.2% |
| 1st Grade | 43 | 9.5% |
| 2nd Grade | 48 | 10.6% |
| 3rd Grade | 44 | 9.7% |
| 4th Grade | 53 | 11.7% |
| 5th Grade | 47 | 10.4% |
| 6th Grade | 48 | 10.6% |
| 7th Grade | 50 | 11.0% |
| 8th Grade | 39 | 8.6% |
Low-Income Enrollment (2011)
Percent of Students from Low-Income Families
School:
100.0%
District:
80.0%
Graduation and Dropout Rates (2010)
Dropout Rate
School:
1.1%
District:
4.1%
Source: PA Department of Education, Source: NCES 2009-2010
School Ratings and Reviews
Overall Rating: 5

5 out of 5 | 1 Review
The Overall Rating is the school's average rating from parents, students, school faculty and staff. The highest rating is five apples and the lowest is one apple.
Share Your Review About This School
1 review for Taggart John H School
- Reviewed by Parent/Guardian on December 27, 2009
- Rating:
 (5 / 5) Flag as inappropriate
 - school calendar
School Map and Similar Schools Nearby
Click to Activate Map of Nearby School Campuses
Private
Public
This School
Similar Schools Nearby
| Sharswood George School PK-8 | 545 Students | 0.3 miles away | Not Yet Rated | |
| Key Francis Scott School KG-6 | 408 Students | 0.4 miles away | Not Yet Rated | |
| Fell D Newlin School KG-8 | 483 Students | 0.5 miles away | Not Yet Rated | |
| Southwark School KG-8 | 456 Students | 0.7 miles away | Not Yet Rated | |
| Vare Abigail School PK-8 | 353 Students | 0.7 miles away | Not Yet Rated | |
| Jenks Abram School KG-4 | 353 Students | 0.8 miles away |  5 out of 5 | |
| Kirkbride Eliza B School PK-8 | 442 Students | 0.9 miles away | Not Yet Rated | |
| Washington George School PK-8 | 344 Students | 1.1 miles away | 5 out of 5 | |
| Girard Stephen School KG-4 | 579 Students | 1.3 miles away | Not Yet Rated | |
| Bregy F Amedee School PK-8 | 409 Students | 1.3 miles away | 5 out of 5 | |
Compare This School To Nearby Schools ->
School Community Forum

Join a discussion about Taggart John H School and talk to others in the community including students, parents, teachers, and administrators.
Popular Discussion Topics
- Admissions and Registration Questions (e.g. Dress Code and Discipline Policy)
- School Calendar and Upcoming Events (e.g. Graduation)
- After School Programs, Extracurricular Activities, and Athletics (e.g. Football)
- News and Announcements (e.g. Yearbook and Class Supply List Details)
- Graduate and Alumni Events (e.g. Organizing Class Reunions)
Navigation
Can't Find What You Are Looking For?
Rankings
Nearby Cities
Sponsored Links
K-12 Articles

Just a Harmless Vanilla Bean?
Some of the greatest, most used, and most profitable breakthroughs in science have not been made by...
Some of the greatest, most used, and most profitable breakthroughs in science have not been made by...

Kids and Competition
In the backyard, the classroom, the community and while participating in sports and other...
In the backyard, the classroom, the community and while participating in sports and other...

Parent-Teacher Conference Dos and Don'ts
Finals are over and done, and grades have arrived. Now comes the dreaded time to discuss the...
Finals are over and done, and grades have arrived. Now comes the dreaded time to discuss the...