Levering William School
Rating
Not Available
Not Available

No Reviews Yet
Find Old Friends From Levering William School
Use the form below to search for alumni from Levering William School.
School Description
School Summary and Highlights
- Enrolls 215 preschool and elementary school students from grades PK-8
- Ranks 742nd out of 875 middle schools in PA.
- 2010 Overall School AYP Met Status: Made AYP
Additional Contact Information
- Principal or Admin: Glenn Douglas
School Operational Details
- Title I EligibleAll students of this school are eligible for participation in authorized programs.
School District Details
- Philadelphia City School District
- Per-Pupil Spending: $9,399
- Graduation Rate: 55.5%
- Dropout Rate: 8.5%
- Students Per Teacher: 14.3
- Enrolled Students: 156,790
Faculty Details and Student Enrollment
Students and Faculty
- Total Students Enrolled: 215
- Total Full Time "Equivalent" Teachers: 17.1
- Average Student-To-Teacher Ratio: 12.5
Students Gender Breakdown
- Males: 113 (52.6%)
- Females: 93 (43.3%)
Free Lunch Student Eligibility Breakdown
- Eligible for Reduced Lunch: - (-)
- Eligible for Free Lunch: 195 (90.7%)
- Eligible for Either Reduced or Free Lunch: 195 (90.7%)
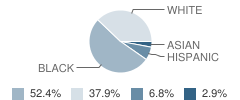
Student Enrollment Distribution by Race / Ethnicity
| Number | Percent | |
|---|---|---|
| American Indian | - | - |
| Black | 108 | 50.2% |
| Asian | 6 | 2.8% |
| Hispanic | 14 | 6.5% |
| White | 78 | 36.3% |
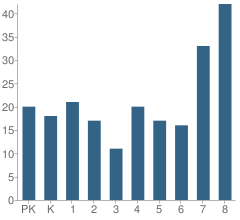
Number of Students Per Grade
| Number | Percent | |
|---|---|---|
| Pre-Kindergarten | 20 | 9.3% |
| Kindergarten | 18 | 8.4% |
| 1st Grade | 21 | 9.8% |
| 2nd Grade | 17 | 7.9% |
| 3rd Grade | 11 | 5.1% |
| 4th Grade | 20 | 9.3% |
| 5th Grade | 17 | 7.9% |
| 6th Grade | 16 | 7.4% |
| 7th Grade | 33 | 15.3% |
| 8th Grade | 42 | 19.5% |
Low-Income Enrollment (2011)
Percent of Students from Low-Income Families
School:
92.9%
District:
80.0%
Source: PA Department of Education, Source: NCES 2009-2010
School Ratings and Reviews
Be The First To Review Levering William School!
School Map and Similar Schools Nearby
Click to Activate Map of Nearby School Campuses
Private
Public
This School
Similar Schools Nearby
| Cook-Wissahickon School PK-8 | 445 Students | 0.7 miles away |  5 out of 5 | |
| Dobson James School KG-8 | 264 Students | 0.9 miles away | Not Yet Rated | |
| Belmont Hills Elementary School KG-5 | 445 Students | 1.3 miles away | Not Yet Rated | |
| Henry Charles W School KG-8 | 501 Students | 1.4 miles away | Not Yet Rated | |
| Lingelbach Anna L School KG-8 | 383 Students | 1.4 miles away | Not Yet Rated | |
| Mifflin Thomas School PK-8 | 330 Students | 1.7 miles away | Not Yet Rated | |
| Shawmont School PK-8 | 598 Students | 1.9 miles away | Not Yet Rated | |
| Cynwyd School KG-5 | 479 Students | 2.0 miles away | Not Yet Rated | |
| Fulton Robert School KG-6 | 324 Students | 2.1 miles away | Not Yet Rated | |
| Houston Henry E School PK-8 | 549 Students | 2.1 miles away | Not Yet Rated | |
Compare This School To Nearby Schools ->
School Community Forum

Join a discussion about Levering William School and talk to others in the community including students, parents, teachers, and administrators.
Popular Discussion Topics
- Admissions and Registration Questions (e.g. Dress Code and Discipline Policy)
- School Calendar and Upcoming Events (e.g. Graduation)
- After School Programs, Extracurricular Activities, and Athletics (e.g. Football)
- News and Announcements (e.g. Yearbook and Class Supply List Details)
- Graduate and Alumni Events (e.g. Organizing Class Reunions)
Navigation
Can't Find What You Are Looking For?
Rankings
Nearby Cities
Sponsored Links
K-12 Articles

All About Backpacks
Your child riffles through his backpack to find homework assignments, his MP3 player, lunch money...
Your child riffles through his backpack to find homework assignments, his MP3 player, lunch money...

Those Pesky Little Transitions
Transitions are rarely easy, yet we have to encounter them every day of our lives. For school-aged...
Transitions are rarely easy, yet we have to encounter them every day of our lives. For school-aged...

Beating the Summer Slump
“The Summer Slump”, teachers call it. It happens every year. It makes its way into lesson plans...
“The Summer Slump”, teachers call it. It happens every year. It makes its way into lesson plans...