Eagle Advantage Charter Elementary School
Rating
Not Available
Not Available

1 out of 5 | 2 Reviews
Find Old Friends From Eagle Advantage Charter Elementary School
Use the form below to search for alumni from Eagle Advantage Charter Elementary School.
School Description
School Summary and Highlights
- Enrolls 1,507 elementary, middle, and high school students from grades KG-12
- Ranks 1150th out of 1,325 high schools in TX.
- 2010 Overall School AYP Met Status: Yes
Additional Contact Information
- Mailing Address: 4011 Joseph Hardin Dr Ste F, Dallas, TX 75236
- Principal or Admin: Mr Sam Cooper
- Fax: (214) 467-9131
School Operational Details
- Title I EligibleAll students of this school are eligible for participation in authorized programs.
- Charter School
School District Details
- Eagle Advantage Schools District
- Per-Pupil Spending: $6,798
- Students Per Teacher: 13.7
- Enrolled Students: 1,507
Faculty Details and Student Enrollment
Students and Faculty
- Total Students Enrolled: 1,507
- Total Full Time "Equivalent" Teachers: 110.3
- Average Student-To-Teacher Ratio: 13.7
Students Gender Breakdown
- Males: 760 (50.4%)
- Females: 747 (49.6%)
Free Lunch Student Eligibility Breakdown
- Eligible for Reduced Lunch: 171 (11.3%)
- Eligible for Free Lunch: 725 (48.1%)
- Eligible for Either Reduced or Free Lunch: 896 (59.5%)
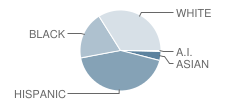
Student Enrollment Distribution by Race / Ethnicity
| Number | Percent | |
|---|---|---|
| American Indian | 6 | 0.4% |
| Black | 287 | 19.0% |
| Asian | 54 | 3.6% |
| Hispanic | 649 | 43.1% |
| White | 511 | 33.9% |
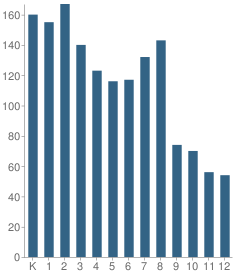
Number of Students Per Grade
| Number | Percent | |
|---|---|---|
| Kindergarten | 160 | 10.6% |
| 1st Grade | 155 | 10.3% |
| 2nd Grade | 167 | 11.1% |
| 3rd Grade | 140 | 9.3% |
| 4th Grade | 123 | 8.2% |
| 5th Grade | 116 | 7.7% |
| 6th Grade | 117 | 7.8% |
| 7th Grade | 132 | 8.8% |
| 8th Grade | 143 | 9.5% |
| 9th Grade | 74 | 4.9% |
| 10th Grade | 70 | 4.6% |
| 11th Grade | 56 | 3.7% |
| 12th Grade | 54 | 3.6% |
Breakdown of College Ready Graduates (2009)
Percent Ready For College in Reading
School:
56.0%
District:
56.0%
State:
62.0%
Percent Ready For College in Math
School:
40.0%
District:
46.0%
State:
60.0%
Faculty Salary (2010)
School Administration Average Base Salary
School:
$53,425
District:
$53,425
State:
$70,209
Teacher Average Base Salary
School:
$35,583
District:
$35,583
State:
$48,263
Beginning Teacher Average Base Salary
School:
$35,583
District:
$35,583
State:
$41,165
Source: TX Department of Education, Source: NCES 2009-2010
School Ratings and Reviews
Overall Rating: 1

1 out of 5 | 2 Reviews
The Overall Rating is the school's average rating from parents, students, school faculty and staff. The highest rating is five apples and the lowest is one apple.
Share Your Review About This School
2 reviews for Eagle Advantage Charter Elementary School
- Reviewed by Parent or Guardian on September 15, 2011
- Rating:
 (1 / 5) Flag as inappropriate
 - Poor leadership and staff. They don't want to hear suggestions from parents concerning their health.
- Reviewed by Parent or Guardian on August 04, 2011
- Rating: (1 / 5) Flag as inappropriate
- Short and Sweet. All I can say is WOW! Advantage Academy is not the school they lead everyone to believe. They don't care about their students, teachers or staff. If you want your child to get a good education then stay away from this school!
School Map and Similar Schools Nearby
Click to Activate Map of Nearby School Campuses
Private
Public
This School
Similar Schools Nearby
| Hampton Preparatory School 9-11 | 132 Students | 4.4 miles away | Not Yet Rated | |
| Life School Oak Cliff KG-12 | 1,273 Students | 4.5 miles away | Not Yet Rated | |
| School of Liberal Arts and Science PK-10 | 714 Students | 5.1 miles away | Not Yet Rated | |
| Gateway Charter Academy - Middle - High 5-12 | 344 Students | 5.5 miles away | Not Yet Rated | |
| Harmony Science Academy Grand Prairie KG-9 | 516 Students | 7.9 miles away | Not Yet Rated | |
| Cedar Hill Collegiate High School 9-10 | 187 Students | 8.3 miles away | Not Yet Rated | |
Compare This School To Nearby Schools ->
School Community Forum

Join a discussion about Eagle Advantage Charter Elementary School and talk to others in the community including students, parents, teachers, and administrators.
Popular Discussion Topics
- Admissions and Registration Questions (e.g. Dress Code and Discipline Policy)
- School Calendar and Upcoming Events (e.g. Graduation)
- After School Programs, Extracurricular Activities, and Athletics (e.g. Football)
- News and Announcements (e.g. Yearbook and Class Supply List Details)
- Graduate and Alumni Events (e.g. Organizing Class Reunions)
Navigation
Can't Find What You Are Looking For?
Nearby Cities
Sponsored Links
K-12 Articles

Public or Private?
Daniel attended private school until sixth grade, when he was diagnosed with Asperger’s Syndrome, a...
Daniel attended private school until sixth grade, when he was diagnosed with Asperger’s Syndrome, a...

Help Your High School Student Create an Impressive Resume
Time has flown. Your teen is in high school and has demonstrated an interest in obtaining a part...
Time has flown. Your teen is in high school and has demonstrated an interest in obtaining a part...

The Pros and Cons of Seat Belts in School Buses
Recently the news has been full of school bus accidents where children have been seriously injured...
Recently the news has been full of school bus accidents where children have been seriously injured...