Central High School
Rating
Not Available
Not Available

No Reviews Yet
Find Old Friends From Central High School
Use the form below to search for alumni from Central High School.
School Description
School Summary and Highlights
- Enrolls 1,596 high school students from grades 9-12
- Ranks 527th out of 1,325 high schools in TX.
- 2010 Overall School AYP Met Status: Yes
Additional Contact Information
- Principal or Admin: Ms Patricia A Lambert V
- Fax: (409) 617-5396
- Website: www.beaumont.k12.tx.us
School Operational Details
- Title I EligibleAll students of this school are eligible for participation in authorized programs.
School District Details
- Beaumont Independent School District (ISD)
- Per-Pupil Spending: $9,397
- Graduation Rate: 66.5%
- Dropout Rate: 5.8%
- Students Per Teacher: 13.6
- Enrolled Students: 19,551
Faculty Details and Student Enrollment
Students and Faculty
- Total Students Enrolled: 1,596
- Total Full Time "Equivalent" Teachers: 117.5
- Average Student-To-Teacher Ratio: 13.6
Students Gender Breakdown
- Males: 763 (47.8%)
- Females: 833 (52.2%)
Free Lunch Student Eligibility Breakdown
- Eligible for Reduced Lunch: 170 (10.7%)
- Eligible for Free Lunch: 1,127 (70.6%)
- Eligible for Either Reduced or Free Lunch: 1,297 (81.3%)
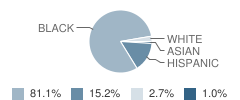
Student Enrollment Distribution by Race / Ethnicity
| Number | Percent | |
|---|---|---|
| American Indian | - | - |
| Black | 1,294 | 81.1% |
| Asian | 16 | 1.0% |
| Hispanic | 243 | 15.2% |
| White | 43 | 2.7% |
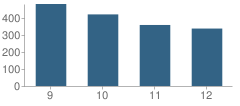
Number of Students Per Grade
| Number | Percent | |
|---|---|---|
| 9th Grade | 481 | 30.1% |
| 10th Grade | 420 | 26.3% |
| 11th Grade | 358 | 22.4% |
| 12th Grade | 337 | 21.1% |
Breakdown of College Ready Graduates (2009)
Percent Ready For College in Reading
School:
23.0%
District:
46.0%
State:
62.0%
Percent Ready For College in Math
School:
46.0%
District:
44.0%
State:
60.0%
Graduation & Dropout Rates (2009)
Graduation Rate
School:
83.9%
District:
82.2%
State:
80.6%
Dropout Rate
School:
14.3%
District:
11.5%
State:
9.4%
Faculty Salary (2010)
School Administration Average Base Salary
School:
$71,513
District:
$73,954
State:
$70,209
Teacher Average Base Salary
School:
$46,719
District:
$47,118
State:
$48,263
Beginning Teacher Average Base Salary
School:
$32,486
District:
$39,240
State:
$41,165
Teacher With 1-5 Years Experience Average Base Salary
School:
$42,116
State:
$43,527
Teacher With 6-10 Years Experience Average Base Salary
School:
$45,499
State:
$46,149
Teacher With 11-20 Years Experience Average Base Salary
School:
$47,231
State:
$50,153
Teacher With Greater Than 20 Years Experience Average Base Salary
School:
$59,856
State:
$58,427
Faculty Breakdown (2010)
Average Teacher Experience
School:
11.4
District:
12.9
State:
11.3
Percent of Teachers With 1-5 Years Experience
School:
34.7%
District:
26.0%
State:
31.0%
Percent of Teachers With 6-10 Years Experience
School:
14.4%
District:
19.0%
State:
20.3%
Percent of Teachers With 11-20 Years Experience
School:
26.0%
District:
26.2%
State:
24.4%
Percent of Teachers With Greater Than 20 Years Experience
School:
18.9%
District:
23.8%
State:
18.3%
Source: TX Department of Education, Source: NCES 2009-2010
School Ratings and Reviews
Be The First To Review Central High School!
School Map and Similar Schools Nearby
Click to Activate Map of Nearby School Campuses
Private
Public
This School
Similar Schools Nearby
| Ozen High School 9-12 | 1,205 Students | 2.0 miles away |  5 out of 5 | |
| West Brook Sr High School 9-12 | 2,463 Students | 4.2 miles away |  3 out of 5 | |
| Vidor High School 9-12 | 1,386 Students | 7.7 miles away | Not Yet Rated | |
| Al Price State Juvenile Correction School 9-12 | 168 Students | 8.1 miles away | 5 out of 5 | |
| Vidor Junior High School 7-8 | 737 Students | 8.3 miles away | Not Yet Rated | |
| Nederland High School 9-12 | 1,463 Students | 9.7 miles away | Not Yet Rated | |
| Port Neches-Groves High School 9-12 | 1,392 Students | 12.1 miles away | 5 out of 5 | |
| Lumberton High School 9-12 | 1,062 Students | 13.3 miles away | Not Yet Rated | |
| Orangefield Junior High School 5-8 | 541 Students | 15.7 miles away | Not Yet Rated | |
| Orangefield High School 9-12 | 536 Students | 15.8 miles away | Not Yet Rated | |
Compare This School To Nearby Schools ->
School Community Forum

Join a discussion about Central High School and talk to others in the community including students, parents, teachers, and administrators.
Popular Discussion Topics
- Admissions and Registration Questions (e.g. Dress Code and Discipline Policy)
- School Calendar and Upcoming Events (e.g. Graduation)
- After School Programs, Extracurricular Activities, and Athletics (e.g. Football)
- News and Announcements (e.g. Yearbook and Class Supply List Details)
- Graduate and Alumni Events (e.g. Organizing Class Reunions)
Navigation
Can't Find What You Are Looking For?
Nearby Cities
Sponsored Links
K-12 Articles

Teaching Your Kids About Respect, Values and Violence
These days it seems that every newscast reports at least once incident of violence. As parents, we...
These days it seems that every newscast reports at least once incident of violence. As parents, we...

Bullies... What Are They Good For?
Bullies have been around since the beginning of time. We had to deal with bullies, and our parents...
Bullies have been around since the beginning of time. We had to deal with bullies, and our parents...

The Importance of Reading for Children Preschool to Grade Three
The first teachers of children are their parents. From the time they are infants, children need to...
The first teachers of children are their parents. From the time they are infants, children need to...