Richards High School
Rating
Not Available
Not Available

3.5 out of 5 | 15 Reviews
Find Old Friends From Richards High School
Use the form below to search for alumni from Richards High School.
School Description
School Summary and Highlights
- Enrolls 58 middle and high school students from grades 7-12
- Ranks 297th out of 1,325 high schools in TX.
- 2010 Overall School AYP Met Status: Yes
Additional Contact Information
- Mailing Address: P O Box 308, Richards, TX 77873
- Principal or Admin: Mr Martey B Ainsworth
- Fax: (936) 851-2210
School Operational Details
- Title I EligibleAll students of this school are eligible for participation in authorized programs.
School District Details
- Richards Independent School District (ISD)
- Per-Pupil Spending: $13,942
- Graduation Rate: 70.0%
- Students Per Teacher: 8.2
- Enrolled Students: 140
Faculty Details and Student Enrollment
Students and Faculty
- Total Students Enrolled: 58
- Total Full Time "Equivalent" Teachers: 9.3
- Average Student-To-Teacher Ratio: 6.2
Students Gender Breakdown
- Males: 29 (50.0%)
- Females: 29 (50.0%)
Free Lunch Student Eligibility Breakdown
- Eligible for Reduced Lunch: 10 (17.2%)
- Eligible for Free Lunch: 29 (50.0%)
- Eligible for Either Reduced or Free Lunch: 39 (67.2%)
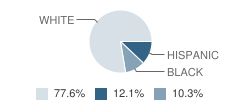
Student Enrollment Distribution by Race / Ethnicity
| Number | Percent | |
|---|---|---|
| American Indian | - | - |
| Black | 6 | 10.3% |
| Asian | - | - |
| Hispanic | 7 | 12.1% |
| White | 45 | 77.6% |
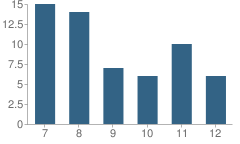
Number of Students Per Grade
| Number | Percent | |
|---|---|---|
| 7th Grade | 15 | 25.9% |
| 8th Grade | 14 | 24.1% |
| 9th Grade | 7 | 12.1% |
| 10th Grade | 6 | 10.3% |
| 11th Grade | 10 | 17.2% |
| 12th Grade | 6 | 10.3% |
Breakdown of College Ready Graduates (2009)
Percent Ready For College in Reading
School:
60.0%
District:
60.0%
State:
62.0%
Percent Ready For College in Math
School:
80.0%
State:
60.0%
Graduation & Dropout Rates (2009)
Graduation Rate
School:
83.3%
District:
83.3%
State:
80.6%
Faculty Breakdown (2010)
Average Teacher Experience
School:
8.4
District:
9.2
State:
11.3
Percent of Teachers With 1-5 Years Experience
School:
43.0%
District:
35.3%
State:
31.0%
Percent of Teachers With 6-10 Years Experience
School:
10.8%
District:
5.9%
State:
20.3%
Percent of Teachers With 11-20 Years Experience
School:
10.8%
District:
17.6%
State:
24.4%
Percent of Teachers With Greater Than 20 Years Experience
School:
21.5%
District:
23.5%
State:
18.3%
Faculty Salary (2010)
School Administration Average Base Salary
School:
$66,002
District:
$66,002
State:
$70,209
Teacher Average Base Salary
School:
$38,231
District:
$37,891
State:
$48,263
Beginning Teacher Average Base Salary
School:
$27,498
District:
$25,630
State:
$41,165
Teacher With 1-5 Years Experience Average Base Salary
School:
$36,555
State:
$43,527
Teacher With 6-10 Years Experience Average Base Salary
School:
$36,150
State:
$46,149
Teacher With 11-20 Years Experience Average Base Salary
School:
$42,190
State:
$50,153
Teacher With Greater Than 20 Years Experience Average Base Salary
School:
$47,620
State:
$58,427
Source: TX Department of Education, Source: NCES 2009-2010
School Ratings and Reviews
Overall Rating: 3.5

3.5 out of 5 | 15 Reviews
The Overall Rating is the school's average rating from parents, students, school faculty and staff. The highest rating is five apples and the lowest is one apple.
Share Your Review About This School
15 reviews for Richards High School
- Reviewed by Teacher on October 10, 2010
- Rating:
 (4 / 5) Flag as inappropriate
 - principal, superintendant, and board members are forward thinking and have created a private school atmosphere at a public school price. student to teacher ratio is 10:1 which offers one-to-one attention. no way to eliminate childish behavior at times, but here is it caught and students are comfortable enough with their teachers to really talk to find the core reasons for their behaviors and work it out. teachers know parents and parents know teachers. the only reason i gave it a 4 and not a 5 is because the facility is old and needs updating, but if the bond passes this fall i will change my ranking to a 5.
- Reviewed by Former Student on September 30, 2010
- Rating:
 (5 / 5) Flag as inappropriate
 - Well I went through 1st grade an graduated from Richards High. The school is like family. The students could work harder , and yes they probably could use some new books. I have went on to college and now working as a nurse but if it was not for the small class size of Richards I would just be another face in the crowd. They do need a new building.
- Reviewed by Former Student on September 29, 2010
- Rating: (5 / 5) Flag as inappropriate
- I went to this ever since K and look where i am now. I am at a college living up my dreams, playing volleyball and getting a degree. Yes, this school has its negatives but the people are what makes it amzing. There are two people you have to meet besides my moms the MOST amzing cooks their, Mrs. Lewis AKA Mrs. America and Clifford Edwards AKA Cliff. They will change you life and make you the best person. I MISS everyone!
- Reviewed by Former Student on September 29, 2010
- Rating:
 (3 / 5) Flag as inappropriate
 - I think that more of the staff could be involved and committed. But there are some great staff members there committed to the students, making their lives better and bettering the town! Overall at least 3 out of 5 apples !!!!
- Reviewed by Parent/Guardian on September 25, 2010
- Rating: (5 / 5) Flag as inappropriate
- My relatives have been members of this community for the past 25 years and have earned great rewards both from the administration and the teachers. Their education was not limited to academics but to the social skills they are using in todays world. As grandparents, we experienced such joy getting to meet with the staff and then to go into the classroom to observe the skills the teachers of today are using in the modern classroom settings at Richards. Students in this area should be encouraged to make full use of their small school's status where they can receive hands on tutoring as opposed to the larger school where they can be deprived of such meaningful closer association. The safety in smaller numbers is also greatly beneficial to a child's daily routine, something valuably lost in the larger school systems. Growth in the community will only bring better exposure to the increasing need for civic duty for improving the educational system in Richards School System. God is leading these students to learn how to adapt today's very stressful demands for being a productive citizen not just for Richards but for the state and unltimately the world. We need encouragement for our students not discouragement by those who wish to disparage the school's ability to grow.
- Reviewed by Parent/Guardian on September 24, 2010
- Rating:
 (1 / 5) Flag as inappropriate
 - I have 3 grandchildren in this school district who have had benefited greatly from their curicullum. 1 is stilll in school, 2 graduated. My grandaughter obtained the highest level in her class, graduating with honors, currently continuing at Sam Houston State. She excelled in all of her classes and after graduating, has devoted a great deal of her time to assist the younger children back in her alma mater in the library to further their interest in the need to delve into the knowledge of the outside world, all that there is to offer to those who wish to contribute to a worthy society. Not only does this benefit the local community, but assures the student of a much richer and fufilling life not just for their own enrichment but for all mankind. All this came from the established roots in the Richardson School District. It may be a SMALL school but the heart of the school clearly shines in the final product it has so richly produces in their graduates. The staff has always been very open in discussing the student progress and their overall development in their social aspects as well. They encourage the students to be thorough in their studies in order to achieve the highest goals for themselves and their fellow classmates. The number #1 place a student needs the strongest support is from their parents who are willing to work closely with the schools staff and the school's administration. Without positive reinforcement , the school district will never be able to grow and produce the quality of life the suburban community exceeds in benefiting our young people of today. Getting back to the roots is a mainstay of what our forefathers hoped for this nation. Do not let that be lost in Richards School District.
- Reviewed by Parent/Guardian on September 24, 2010
- Rating: (5 / 5) Flag as inappropriate
- You know as People are Thinking & Hopefully Praying about this choice for Bettering the Future for our Children.. For reaching out to the Generation now and Generations to come,,I Pray we don't live in the Past,, I Pray We see What Richards RISD can Be and not just what it was in the past or even now,, That we can have a vision of Hope for our Kids of the Future.. I have had my kids in RISD and I have taken them out.. Due to circumstances but I personally found my kids were more active more positive more at Peace with Their School in Richards than the one in Huntsville,,,Now this is my children not speaking for anyone else nor saying bad things towards Huntsville either just my personal story with my kids..Everyone has their own story their own opinion. When I talk with my kids about whats going on and what they think,,,Their words are we are not going anywhere,,we have been others places this is OUR School why do people not want us to have better like all the other schools?
Generations of Folks live in this area most have gone to RISD. Grown in this area,,everyone knowing everyone,,I love that about Richards and Richards Folks we are like a really big family that God has devinely placed together, and he exspects us to put selfish thoughts and desires away and Look to the Future for our Children For Our Childrens Vision Not our own selfish wants, or what we think is best but Put God first in this,, Place this on your Prayer list I know My God knows whats Best and I Trust HIM with the out come of all this But My Prayer is that we dig deep and ask is it just the money, is it just I do not care, is it you have had a bad taste about RISD. What ever the reason we all MAY have wether for or against this my prayer is. You look into the Eyes of these Kids and tell them we DONT SUPPORT YOUR VISIOIN! WE ALL HAVE THE RIGHT TO SPEAKE UP ON THIS AND AGAIN I PRAY WE DONT LOOK INTO THE PAST GENERATIONS OF RISD AND SAY IT WASNT THEN AND IT WANT BE NOW. BUT WE PUT THE PAST IN THE PAST AND WE PRESS ON INTO THE FURTURE TELLING OUR KIDS YOU KNOW WE DONT KNOW HOW BUT ONE THING WE DO KNOW OUR GOD IS A AWSOME GOD AND HE DOES NOT WANT HIS CHILDREN TO SETTLE FOR JUST ENOUGH! OUR SCHOOL IS GREAT IN THAT ITS FILLED WITH FINE FINE TEACHERS, TEACHERS THAT LOVE AND CARE & are qualified for the calling!(THATS BIG RIGHT THERE) REMEMBER IVE BEEN TO OTHER SCHOOLS! I KNOW.
BEFORE MY KID GETS HOME, WHAT HAPPENED THAT DAY GOOD OR BAD I know about it already. ANYTIME I HAVE CALLED with concerns- YES MAAM WERE ON THAT FOR YOU... OR I WILL TAKE CARE OF THAT AND GET BACK WITH YOU.. OR WE WILL SUPPORT YOU ON THIS,, TEAM WORK THATS WHAT I SEE AT RISD BETWEEN PRINCIPAL TEACHER AND PARENT... IS RISD PERFECT OF COARSE NOT,,,THERES NOT ANYTHING PERFECT. YOU CAN SET ON THE SIDE WAGON POINTING YOUR FINGER SAYING WHAT WE ARE NOT. OR YOU CAN GET ON BOARD AND LOOK INTO THESE KIDS EYES AND SAY LETS MAKE THIS HAPPEN AND BELIEVE GOD FOR GREAT GREAT THINGS to come from this.
WHEN THERE SEEMS KNOW WAY AT ALL!!
GET OUT OF THE WAY GOD IS ABOUT TO DO SOMETHING TO AMAZE US ALL.......
ALL THIS MAY NOT BE TYPED TO YOUR PERFECTION BUT THIS IS MY HEART AND I AM A MOTHER OF 2 AT RISD AND WILL BE FOR 11 MORE YEARS AND THEN AFTER THAT ONE DAY A GRAND PARENT AND I PRAY THAT THIS SCHOOL CAN BE A BLESSING TO THE GENERATIONS TO COME AMEN
MY DAUGHTER IS A A
- Reviewed by Parent/Guardian on September 24, 2010
- Rating: (5 / 5) Flag as inappropriate
- A great all around school. With improved facilities can be even better.
- Reviewed by Community Member on September 24, 2010
- Rating: (4 / 5) Flag as inappropriate
- A very caring, dedicated admin and staff.
Not perfect, but striving for perfection. Students are individuals, families are known and attention is individualized. This is one of the few schools that still has a heart beat and hears the needs of the students and community.
Richards produces teachers, business owners, law enfordement, and even a
Texas Ranger. I believe the state of Texas rated Richards exemplary.
- Reviewed by Former Student on September 23, 2010
- Rating: (5 / 5) Flag as inappropriate
- As a graduate, I can guarantee you that Richards offers everything that a student needs to be ready for college. It really disappoints me that people would say such things about a school that has done nothing but provide for its students and parents for so long. I'm going to graduate with a college degree at 20 years old, and I've already travelled to many different countries, and I've never felt like my education was lacking. I am currently doing an internship for Walt Disney World and they didn't find my education questionable. Of course every school has problems, but what matters most is there - safety and education - not to mention convenience! I was a student of RISD from 1st grade to senior year, and I never once feared for my safety. My teachers always encouraged me and helped me go above and beyond. Our high school programs were wonderful - I went to Walt Disney World 2 times with the school, and now I'm working here. If that's not an example of encouragement and influence, I don't know what is. If anyone thinks students of are school aren't ready for college, I will plainly tell you - THEY ARE WRONG. Our school provides the education needed to get the students admitted and even impress donors enough for scholarships, and we thrive there! What is wonderful about RISD is that it allows students to go above and beyond, doesn't limit them to the status quo, all the while encouraging a one-on-one relationship between the students and teachers.
By-the-way - our One-Act Play program has an amazing reputation, as will tell you anyone that has competed with us in the past. (:
- Reviewed by Parent/Guardian on September 23, 2010
- Rating: (5 / 5) Flag as inappropriate
- A great school where kids can learn without the distractions in larger schools. Can't say enough about the family like feel of the school. Would not want to send my kids anywhere else.
- Reviewed by Parent/Guardian on September 23, 2010
- Rating: (1 / 5) Flag as inappropriate
- Two of my kids go to this school. It is an excellent place to have your kids. Your children are cared for and loved. Unlike many larger schools Richards provides a safe, caring, environment where you can feel confident that your children are receiving an excellent education in a family like setting.
- Reviewed by Parent/Guardian on September 23, 2010
- Rating: (5 / 5) Flag as inappropriate
- Extremely caring staff, safe atmosphere, no gangs, no violence. Low student to teacher ratio. Distance learning and dual credit opportunities are available for all high school students, even offering reimbursement for tuition. My children were well prepared for college, as well as the work force. No teachers on campus are working on certifications, all qualified.
- Reviewed by Parent/Guardian on August 12, 2009
- Rating: (1 / 5) Flag as inappropriate
- as a former student with children here, I have to say this school is lacking. the highschool needs more teacher participation and the school administration needs to do whats right for the students and not themselves. no one pushes these kids hard enough. a lot of times with the education that the students get on the highschool level these students are not even ready for college.
- Reviewed by Community Member on May 08, 2009
- Rating: (1 / 5) Flag as inappropriate
- It seems to me that this school could be consolidated with Anderson/Shiro to provide a higher and better education for the students in the 21st century.
Read All 15 Reviews ->
School Map and Similar Schools Nearby
Click to Activate Map of Nearby School Campuses
Private
Public
This School
Similar Schools Nearby
| Anderson-Shiro Secondary School 6-12 | 360 Students | 9.1 miles away | Not Yet Rated | |
| Montgomery High School 9-12 | 1,929 Students | 12.4 miles away |  5 out of 5 | |
| Montgomery Junior High School 7-8 | 1,030 Students | 14.7 miles away | Not Yet Rated | |
| Navasota Junior High School 6-8 | 578 Students | 16.1 miles away | Not Yet Rated | |
| Navasota High School 9-12 | 810 Students | 16.3 miles away | Not Yet Rated | |
| Iola High School 7-12 | 241 Students | 20.9 miles away |  3.5 out of 5 | |
| New Waverly High School 9-12 | 270 Students | 21.3 miles away |  2 out of 5 | |
| New Waverly Junior High School 6-8 | 200 Students | 21.7 miles away | Not Yet Rated | |
| Magnolia West High School 9-12 | 1,718 Students | 22.5 miles away |  1 out of 5 | |
| Huntsville High School 9-12 | 1,811 Students | 22.9 miles away | Not Yet Rated | |
Compare This School To Nearby Schools ->
Navigation
Can't Find What You Are Looking For?
Nearby Cities
Sponsored Links
K-12 Articles

Teaching Kids to Deal with Peer Pressure
Parents usually become very concerned when they hear the term "peer pressure." However, peer...
Parents usually become very concerned when they hear the term "peer pressure." However, peer...

Helping Your Child Leave the Nest
It's all come down to this: Eighteen years of good times and bad, and now your baby bird is ready...
It's all come down to this: Eighteen years of good times and bad, and now your baby bird is ready...

Nothing New Under the Sun
"I had to go through the same thing when I went to school." Every parent has uttered this phrase,...
"I had to go through the same thing when I went to school." Every parent has uttered this phrase,...