Shiner High School
Rating
Not Available
Not Available

No Reviews Yet
Find Old Friends From Shiner High School
Use the form below to search for alumni from Shiner High School.
School Description
School Summary and Highlights
- Enrolls 259 middle and high school students from grades 7-12
- Ranks 189th out of 1,325 high schools in TX.
- 2010 Overall School AYP Met Status: Yes
Additional Contact Information
- Mailing Address: P O Box 804, Shiner, TX 77984
- Principal or Admin: Mr Don Wild
- Fax: (361) 594-4295
- Website: shinerisd.net
School Operational Details
- Title I EligibleAll students of this school are eligible for participation in authorized programs.
School District Details
- Shiner Independent School District (ISD)
- Per-Pupil Spending: $6,824
- Graduation Rate: 96.2%
- Students Per Teacher: 12.4
- Enrolled Students: 559
Faculty Details and Student Enrollment
Students and Faculty
- Total Students Enrolled: 259
- Total Full Time "Equivalent" Teachers: 25.0
- Average Student-To-Teacher Ratio: 10.4
Students Gender Breakdown
- Males: 131 (50.6%)
- Females: 128 (49.4%)
Free Lunch Student Eligibility Breakdown
- Eligible for Reduced Lunch: 18 (6.9%)
- Eligible for Free Lunch: 66 (25.5%)
- Eligible for Either Reduced or Free Lunch: 84 (32.4%)
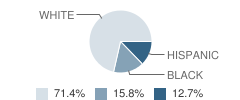
Student Enrollment Distribution by Race / Ethnicity
| Number | Percent | |
|---|---|---|
| American Indian | - | - |
| Black | 41 | 15.8% |
| Asian | - | - |
| Hispanic | 33 | 12.7% |
| White | 185 | 71.4% |
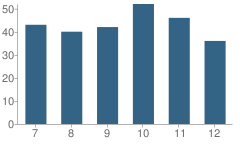
Number of Students Per Grade
| Number | Percent | |
|---|---|---|
| 7th Grade | 43 | 16.6% |
| 8th Grade | 40 | 15.4% |
| 9th Grade | 42 | 16.2% |
| 10th Grade | 52 | 20.1% |
| 11th Grade | 46 | 17.8% |
| 12th Grade | 36 | 13.9% |
Breakdown of College Ready Graduates (2009)
Percent Ready For College in Reading
School:
69.0%
District:
69.0%
State:
62.0%
Percent Ready For College in Math
School:
65.0%
State:
60.0%
Graduation & Dropout Rates (2009)
Graduation Rate
School:
100.0%
District:
100.0%
State:
80.6%
Faculty Salary (2010)
School Administration Average Base Salary
School:
$65,600
District:
$65,716
State:
$70,209
Teacher Average Base Salary
School:
$44,731
District:
$42,358
State:
$48,263
Teacher With 1-5 Years Experience Average Base Salary
School:
$41,352
State:
$43,527
Teacher With 6-10 Years Experience Average Base Salary
School:
$39,147
State:
$46,149
Teacher With 11-20 Years Experience Average Base Salary
School:
$53,704
State:
$50,153
Teacher With Greater Than 20 Years Experience Average Base Salary
School:
$48,395
State:
$58,427
Faculty Breakdown (2010)
Average Teacher Experience
School:
16.9
District:
14.3
State:
11.3
Percent of Teachers With 1-5 Years Experience
School:
7.2%
District:
19.9%
State:
31.0%
Percent of Teachers With 6-10 Years Experience
School:
44.1%
District:
33.2%
State:
20.3%
Percent of Teachers With 11-20 Years Experience
School:
17.3%
District:
22.9%
State:
24.4%
Percent of Teachers With Greater Than 20 Years Experience
School:
31.4%
District:
24.0%
State:
18.3%
Source: TX Department of Education, Source: NCES 2009-2010
School Ratings and Reviews
Be The First To Review Shiner High School!
School Map and Similar Schools Nearby
Click to Activate Map of Nearby School Campuses
Private
Public
This School
Similar Schools Nearby
| Moulton High School 7-12 | 122 Students | 9.2 miles away | Not Yet Rated | |
| Yoakum Junior High School 6-8 | 345 Students | 10.9 miles away | Not Yet Rated | |
| Yoakum High School 9-12 | 453 Students | 10.9 miles away | Not Yet Rated | |
| Hallettsville Junior High School 5-8 | 240 Students | 14.5 miles away | Not Yet Rated | |
| Hallettsville High School 9-12 | 311 Students | 14.6 miles away |  1 out of 5 | |
| Cuero Junior High School 7-8 | 280 Students | 25.2 miles away | Not Yet Rated | |
| Cuero High School 9-12 | 588 Students | 25.5 miles away | Not Yet Rated | |
Compare This School To Nearby Schools ->
School Community Forum

Join a discussion about Shiner High School and talk to others in the community including students, parents, teachers, and administrators.
Popular Discussion Topics
- Admissions and Registration Questions (e.g. Dress Code and Discipline Policy)
- School Calendar and Upcoming Events (e.g. Graduation)
- After School Programs, Extracurricular Activities, and Athletics (e.g. Football)
- News and Announcements (e.g. Yearbook and Class Supply List Details)
- Graduate and Alumni Events (e.g. Organizing Class Reunions)
Navigation
Can't Find What You Are Looking For?
Nearby Cities
Sponsored Links
K-12 Articles

Keep Kids Learning All Summer
Early in the 20th century schools in urban districts operated all year ‘round. However, in rural...
Early in the 20th century schools in urban districts operated all year ‘round. However, in rural...

Feeling Good in Your Own Skin
Body image is a very touchy issue with today’s kids. Since the 1950s, when Barbie was first...
Body image is a very touchy issue with today’s kids. Since the 1950s, when Barbie was first...

Everyone Loves Going to the Doctor and Dentist
Going to the doctor or dentist can be traumatic for children of all ages. Many adults do not...
Going to the doctor or dentist can be traumatic for children of all ages. Many adults do not...